3.4.1.2. TOOLS for Navisworks PRO
SIGNAX Settings
SIGNAX Settings - window for authorization and plugin settings.

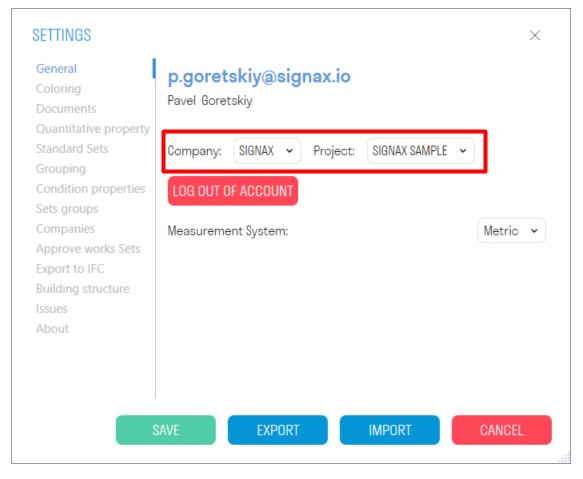
General
General - license verification before starting work with the plugin. Use your login and password if you have purchased the TOOLS module only(SIGNAX for Revit/SIGNAX for Navisworks). Select "Use the DASHBOARD license authorization" if the plugins are part of the DASHBOARD module.
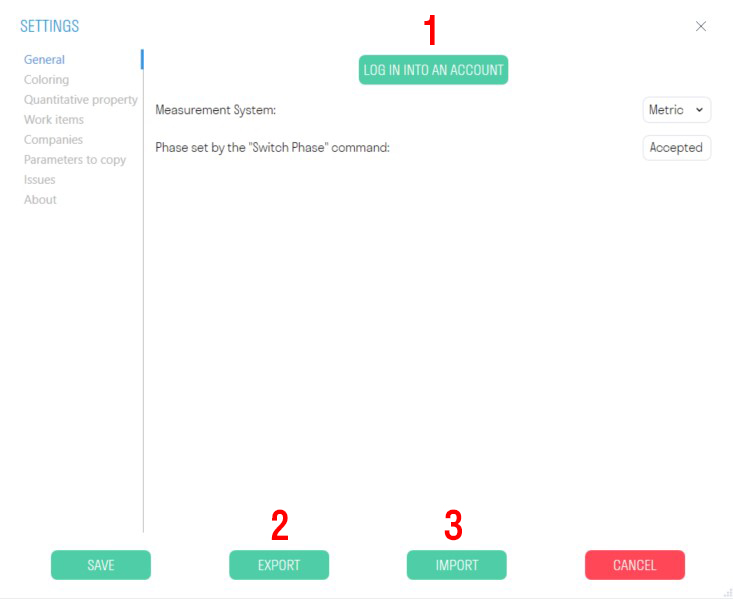
- Log in with your account.
- Export plugin settings to an XML file. You can share the settings file with your colleagues so that when working with the plugin, they can use the same settings.
- Import plugin settings in XML format.
Coloring
This setting allows you to specify colors for highlighting elements when using specific commands.
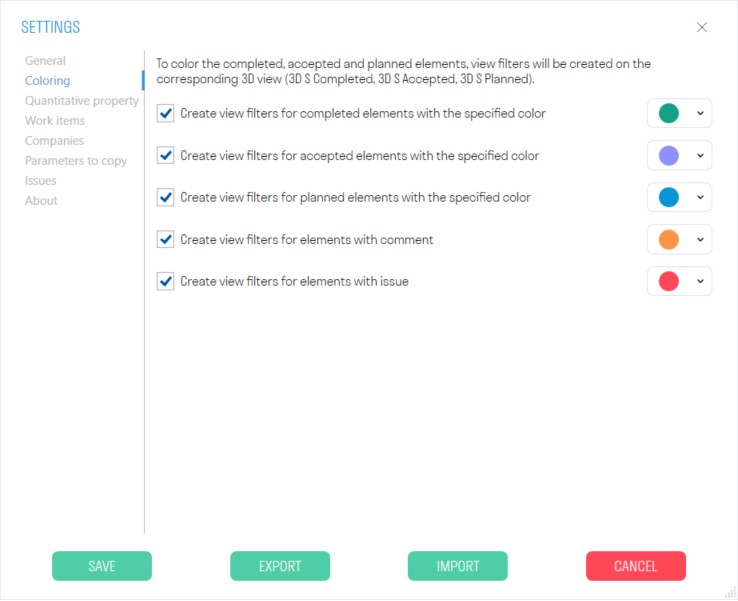
- At the top of the window, choose from the dropdown list the colors with which the elements will be highlighted after executing specific commands.
Notice: For the commands 'Complete', 'Accept', and 'Plan' the color will be set in the SIGNAX-Color property. For the commands 'Comment' and 'Issues' the color will be set in the SIGNAX-IssueColor property.
- At the bottom of the window, you'll find the allowable names of issue statuses for files from BIM360 (ACC Docs). For each color, specify the names of the statuses separated by commas. When importing issues from BIM360 (ACC Docs) using the 'From B360' command, elements will be colored according to the specified status colors.
If a particular status doesn't require highlighting remove it from all lists.
Documents
Documents - the root path leads to the local computer folder with the documents attached to the project elements. The attached document will hide the root path. SIGNAX will display the path after the root folder.

- Select the path to the folder with documents by clicking '...'
Use case:
After linking all the necessary documentation to the elements, you can send an archive with documents and the model in NWD format to another user. The user saves the archive on their local computer or server, then extracts it and specifies the new path to the root folder in the model. This way, all documents will be linked into the model.
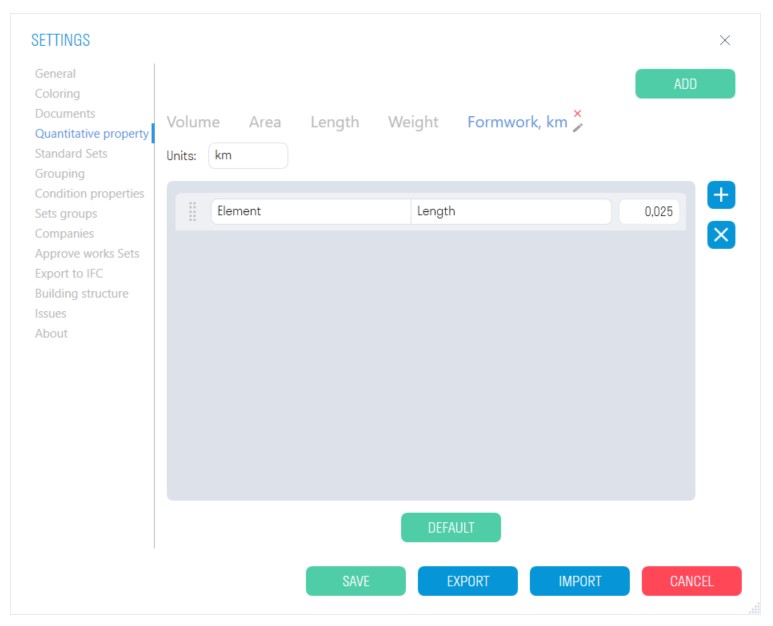
Quantitative property
- The current list specifies pairs of 'Category-Property' that serve as criteria for collecting cumulative numerical characteristics of elements (Volume/Area/Length/Weight) when working with the 'Calculations' section. If an element has at least one property in the specified category, the value of that property is taken for calculation. The order of parameters in the list corresponds to the search order of parameters in the element.
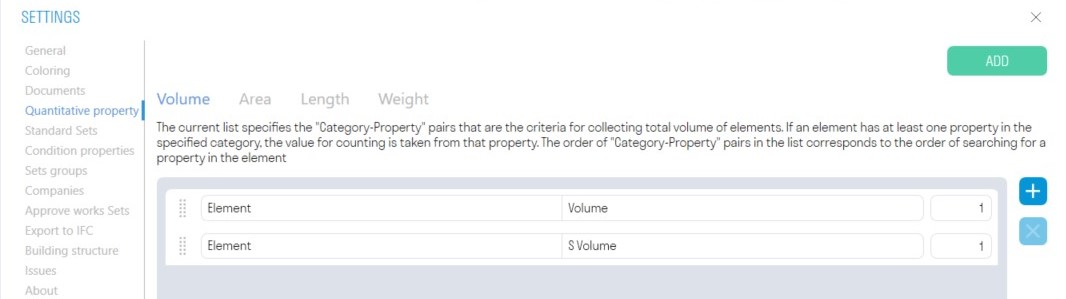
- To add a new 'Category-Property' pair, click
 .
. - In the 'Category' field, enter the name of the tab where the desired property is located.
- In the 'Property' field, enter the name of the property from which the value will be taken.

- The third column with the coefficient serves to convert between units of measurement, for example, meters to kilometers or kilograms to tons.
 .
.
Important: The names must be entered exactly as they are written in the property panel, respecting capital letters, spaces, hyphens, etc., so that the plugin can locate the specified category and property.
2. If necessary, create your own quantitative properties that can be used for standardization to a common unit of measurement, such as meters to kilometers or kilograms to tons. To do this, click 'Add' in the upper right corner.
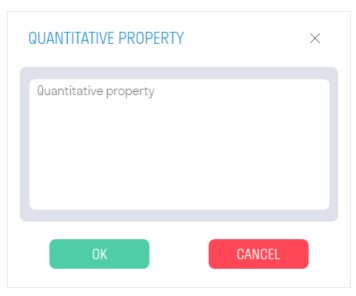
- Enter the name of the quantitative property and click 'OK'.
3. Enter the units of measurement, the pair "Category-Property", and the conversion coefficient from one unit of measurement to another.
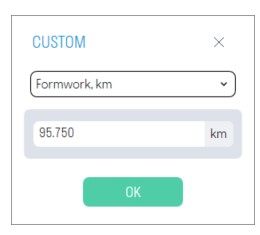
4. Close the settings by saving them at the bottom of the window. Then select the necessary elements and, using the "CUSTOM" command on the Calculations tab, view the specified numerical characteristic.
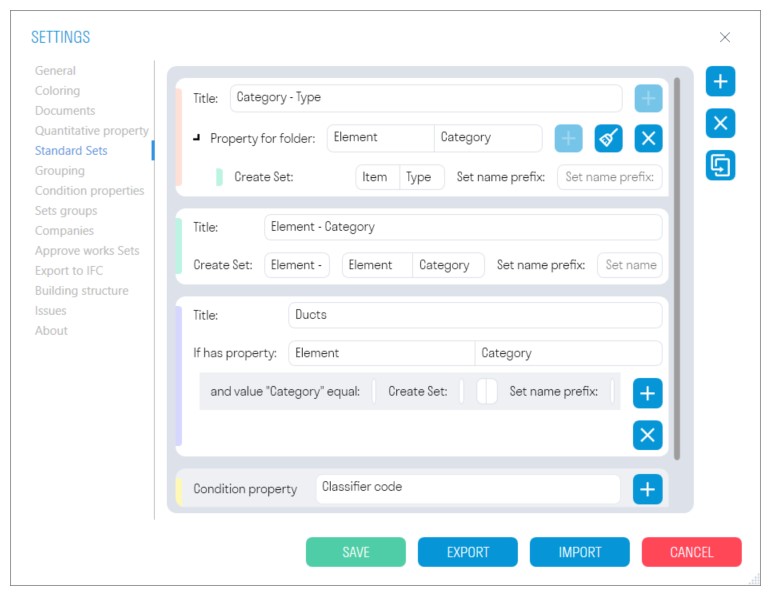
Standard Search Sets
The "Standard Search Sets" setting allows you to create search sets based on specific rules. For instance, you can use this tool to divide the information model in various ways such as system types, equipment types, materials, and more using "Standard" tool. These rules can be customized to suit your needs and help you organize and manage your data effectively.
Click on the Settings panel ➤ Settings ➤ Standard Search Sets.
- To duplicate a rule with values, select it and press
 .
.

2. To add a Search Set creation rule, click ![]() and select one of the rules
and select one of the rules
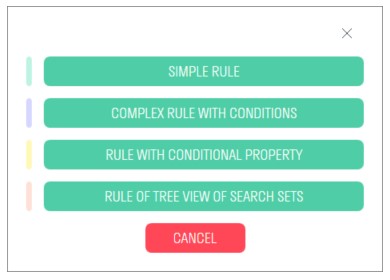
2.1 Simple rule:
This rule allows you to split the model by any one of the properties, for example, by category, assembly code, floor, building, etc.
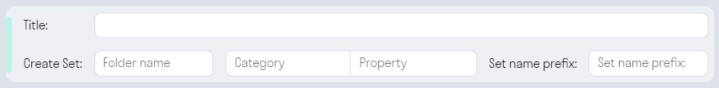
- In the "Title" field, enter the name of the rule that will be displayed in the "Standard" creation window.
- In the "Folder Name" field, enter the folder name where the search sets will be created.
- In the "Category - Property" field, enter the category and property by which the search sets will be created.
- In the "Prefix" field, you can enter a prefix for the search set, for example, "Category-".
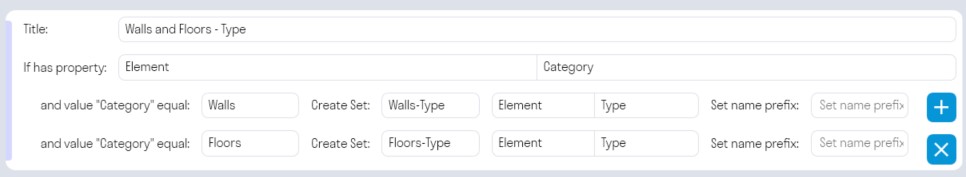
2.2. Complex rule with conditions:
This rule allows you to divide elements with specific values across different properties. For example, elements with the category value "Wall" can be divided by "Type" or "Floor".
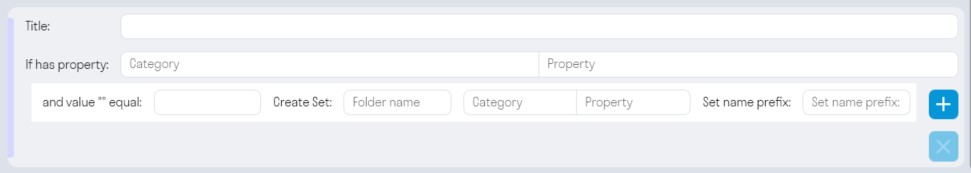
- In the "Title" field, enter the name of the rule that will be displayed in the "Standard" creation window.
- According to the algorithm, if an element possesses a specific property, such as "Category" and the value of this property is "Walls", then search sets are created in the folder that divide these elements by the property, for example, "Type."
Properties are specified as “Category-Property” pairs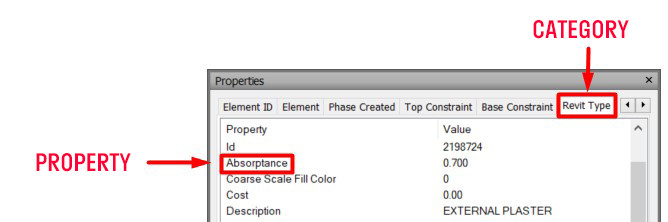
-
In the "Folder Name" field, enter the name of the folder where the search sets will be created
-
In the "Prefix" field, you can enter a prefix for the search set, for example, "Type -".
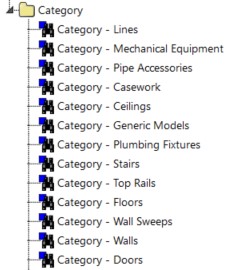
For example, classify elements of the "Wall" and "Floor" categories by "Type":

2.3. Rule with conditional property:
This rule allows you to split the model by a "Conditional property".

- Click on the "+" and select from the list "Conditional property" by which you want to split the model, for example, "Classifier Code".
- In the "Folder Name" field, enter the name of the folder where the search sets will be created.
- In the "Prefix" field, you can enter a prefix for the search set, for example, "Code - ".
For example, let's classify the model by Assembly code:

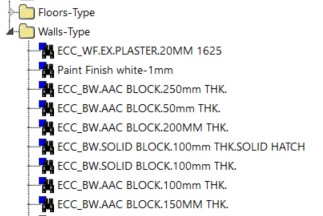
Conditional properties
This is a set of properties of elements that in different models or in different elements represent the same conditional property. For example, the property "Level" in different elements can be under "Element - Base level" or "Element - Level". This setting is used in "Standard Search Sets" when creating search sets, as well as when exporting properties.
Click on the Settings panel ➤ Settings ➤ Conditional properties.
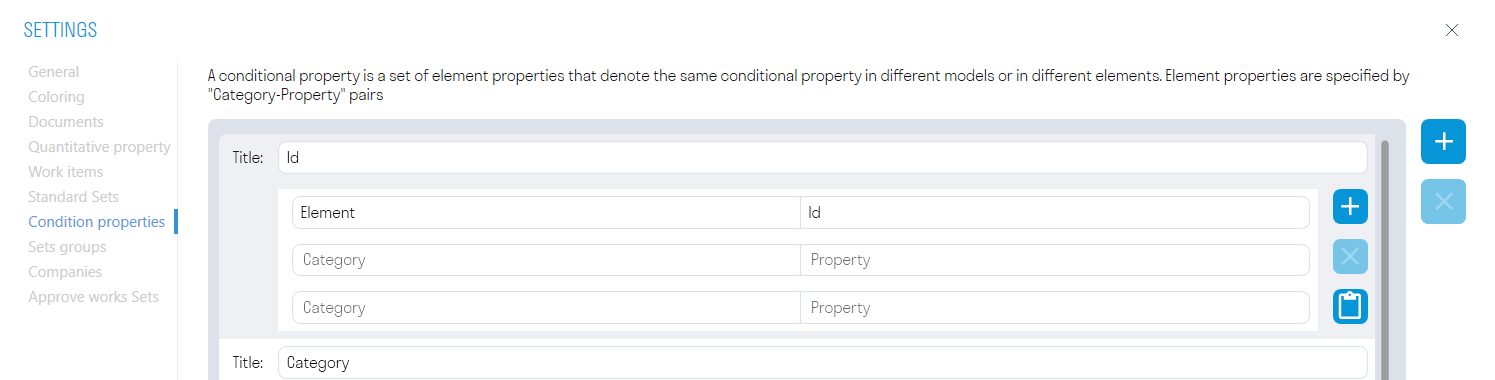
- Conditional properties are specified as pairs "Category-Property".

- You can copy data from Excel. To do this, select the cells in Excel, press Ctrl+C, go to the plugin, and click the "Paste data from Excel" button. The data will be copied into Conditional Properties.
Sets groups
The setting allows you to add groups of sets with elements that need to be checked for intersections using the Checker tool.
Click on the Settings panel ➤ Settings ➤ Set Groups
Using the "Standard" command, previously create search sets with elements that need to be checked for intersections.
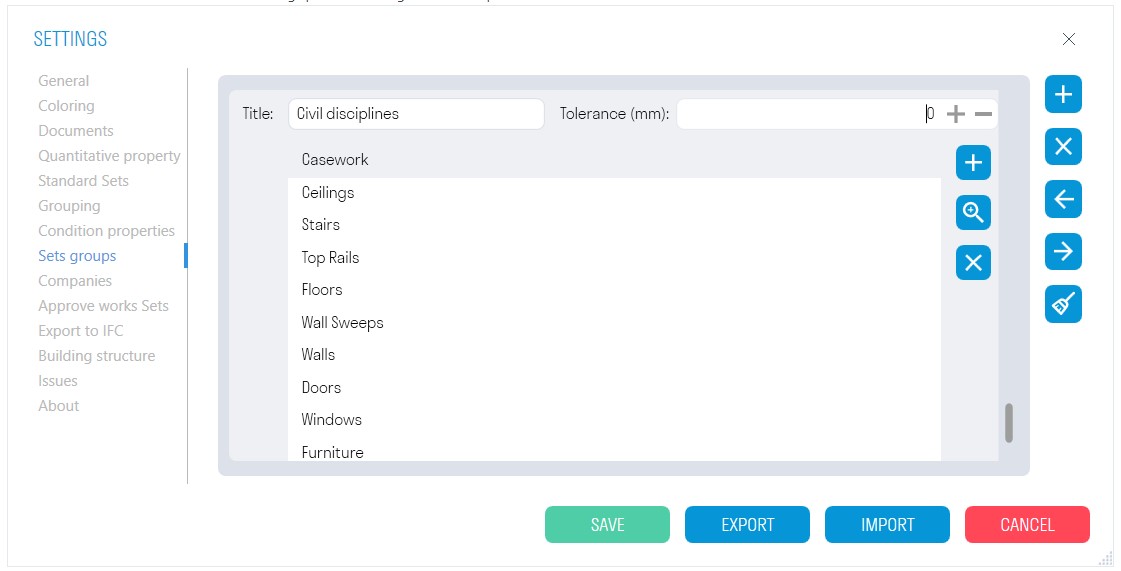
- Create a group by clicking
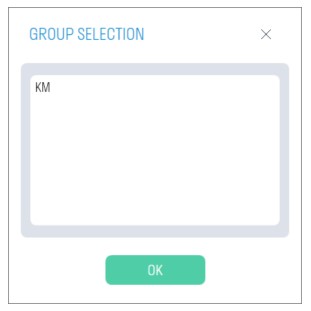
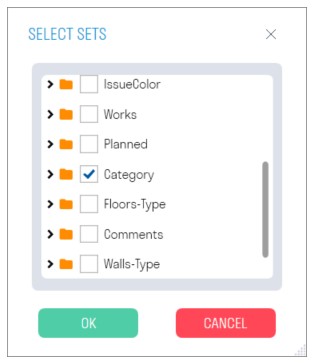
 , write the name of the group, set the tolerance for element intersections, and add the necessary search sets to the group.
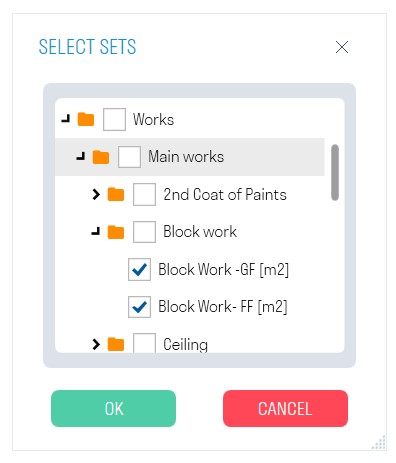
  allows you to add the created search sets to the group. Select sets and click "OK".

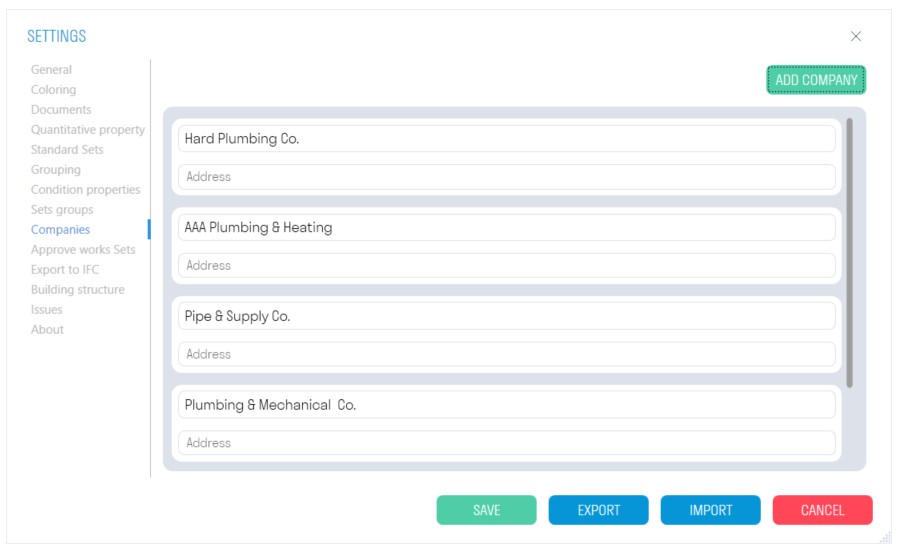
Companies
The setting allows you to add Companies that perform specific types of work on the project and specify them when using the Completed/Accepted/Planned tools.
- Click on the Settings panel ➤ Settings ➤ Companies.
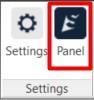
SIGNAX Panel
The SIGNAX panel allows you to gather information about an element or sets of elements in one place. It contains various auxiliary functions for convenient work with SIGNAX properties, attachment of various documents to model elements, interaction with work types, and quick setup of optimal views.
Click on the SIGNAX tab on the Settings panel ➤ Panel
SIGNAX Properties
On this tab, all SIGNAX properties and their values are displayed, as well as the quantitative values (Volume/Area/Length/Weight) of the selected elements.
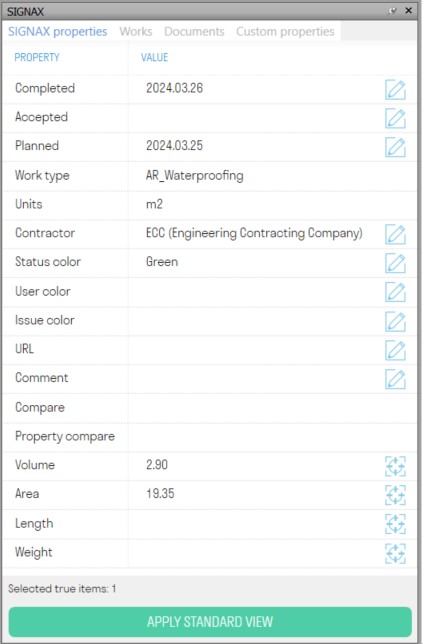
- The "APPLY STANDARD VIEW" button changes the settings of the view screen for more comfortable work with the model.
- The "Edit"
 button allows you to edit the value of a property of selected elements.

Works
On this tab, the settings for work types and favorite properties are displayed.
Types of works
The setting allows you to add Work Types, which will be specified when using the Completed/Accepted/Planned, Invoice, Report, and Budget tools. Prepare your structure by work types used on the project. Work types are located on the SIGNAX panel under the "Works" tab.
Click on the Settings panel ➤ "Panel" ➤ "Works" tab.Folders and work types can be added manually or imported from a ready Excel file.
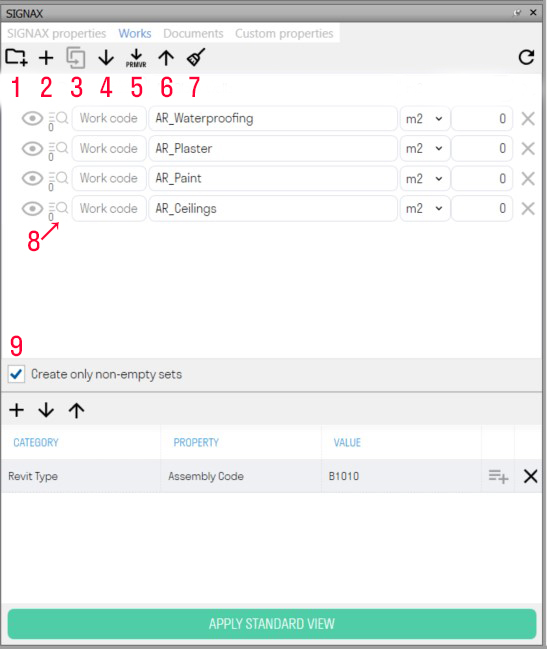
- Adding a new folder.
- Adding a new work type.
- The "Duplicate" button allows you to duplicate the selected folder or work type while retaining the values and conditions within the work types.
- Import work types from an Excel spreadsheet.
- Import work types from an XML file exported from Primavera. Import work types from Primavera, mark work completion, and export completion percentage using "Percent Primavera".
- Export work types to an Excel spreadsheet.
- Clear the list of work types.
- Conditions for creating search sets.
- If the "Create only non-empty sets" toggle is active, only those search sets that satisfy the conditions for creating sets will be created. If the toggle is not active, search sets will be created for all work types, even those with incorrectly filled creation conditions. If creation conditions are not filled, regardless of the toggle position, no sets will be created.
With the "Works" tool, you can create search sets for work types, but to do this, you need to specify the conditions for creating sets.
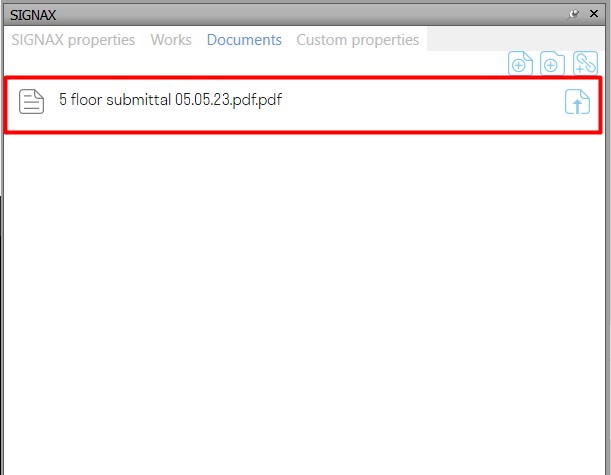
Documents
The folders and files attached to the elements are displayed on this tab.
To attach local files and folders from your computer, in the "Documents" settings, specify the path to the root folder with documents.
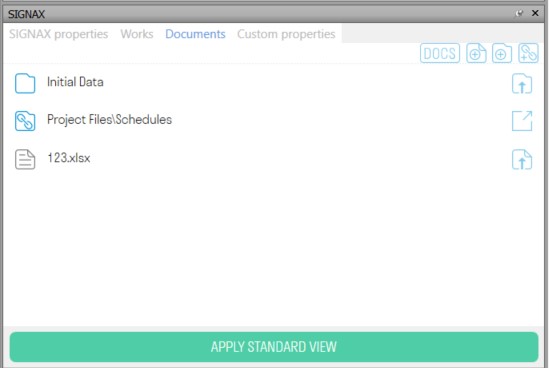
- The "Go to Web Document" button
 allows you to open the attached file or folder in BIM360 (ACC Docs).
 - The "Open File" button
 allows you to open the attached local file.
 - The "Open Folder" button
 allows you to open the attached local folder.
 - Select the element and click
 , to attach a local file. A window with folders and files will open. Check the box next to the file or files, and click "OK".


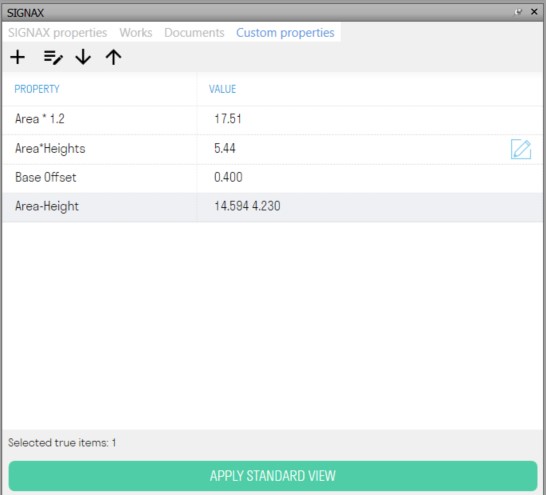
Custom properties
On this tab, user properties and their values are displayed. There are four types of user properties: Calculated, Editable, Quantity with Coefficient, and Multi-Calculated.
SIGNAX Features
Completed/Accepted/Planned
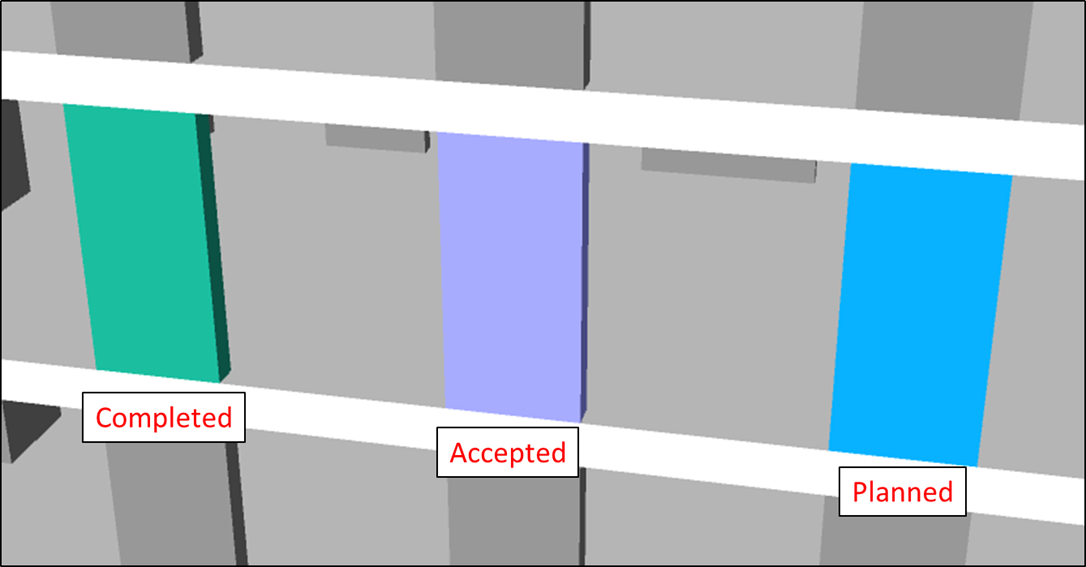
Using the commands Completed, Accepted, and Planned, you can assign the corresponding status to elements.
- Select the element/elements and click on the SIGNAX tab on the Coordination panel ➤ Completed/Accepted/Planned.
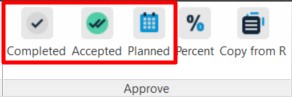
- Completed - actual completion date.
- Accepted - date of approval/payment
- Planned - planned date with assignment of performer.
The settings windows for the Complete/Accept/Planned commands look as following.
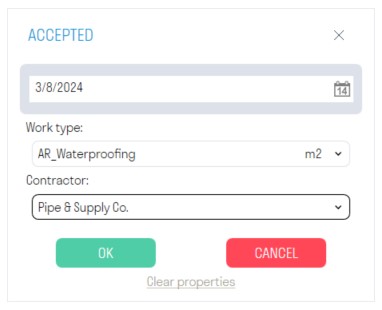
- In the "Date" field, specify the completion date.
- In the "Work Type" field, choose from the list the type of work associated with the element. Works can be added in two ways - manually or by importing an Excel table (see more in "Work Types Setup").
- In the "Contractor" field, choose from the list the company that performs the specified type of work. You can add a company in the Signax plugin settings (see more in "Company Setup").
- The "Clear Properties" button deletes the S parameter values from the selected elements.
- After assigning the status, the following happens:
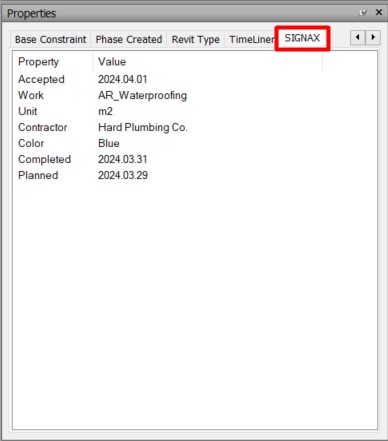
- Search sets “Completed”, “Accepted”, “Planned” and “Color” are created

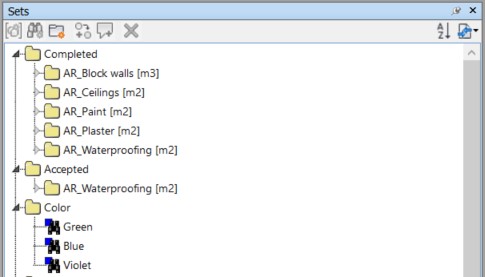
- The selected elements are painted in colors corresponding to their status. By default, Completed is Green, Accepted is Purple, Planned is blue. If desired, the colors can be changed in the plugin settings (see Coloring)
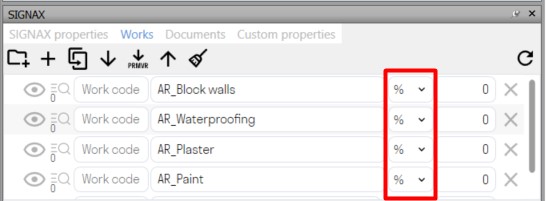
Percent
The tool provides the ability to record the percentage of work completed for each model element. For example, it can be used to evaluate the progress of utilities by floor, apartment, or room. This allows you to more accurately monitor the progress of work and assess the degree of completion of the project.
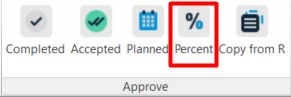
- Select the element(s) and click on the SIGNAX tab in the Approve ➤ Percentage
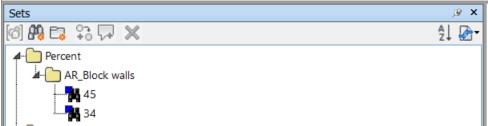
- Search sets are created with the percentage value.
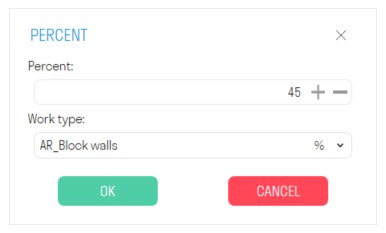
- In the opened window, specify the percentage of work completion and choose the type of work from the dropdown list. Then click "OK".

- To add work types to the list, you need to set the units of measurement to "%" for them in the SIGNAX Panel.
3. After assigning the percentage, the following happens:
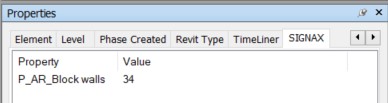
• In the properties of the selected elements in the "SIGNAX" tab, the corresponding property "P_{Work Type}" appears.
- Search sets are created with the percentage value.


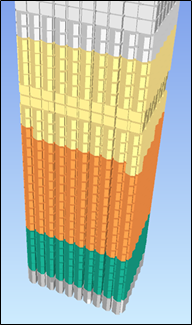
- To color elements by percentage, use the "Colorize" tool.

Copy from R
The tool is used to copy coordination S parameters from the "Object" tab to the "SIGNAX" tab if status assignment (work approval) was done in Revit.
- Click on the SIGNAX tab on the Approve panel ➤ Copy from R.
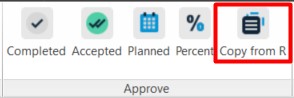
2. In the elements that have been assigned statuses, the properties "S Completed", "S Accepted", and "S Planned", as well as "S Work", "S Unit", "S Color", and "S Contractor" from the "Object" tab will be copied to the "SIGNAX" tab.
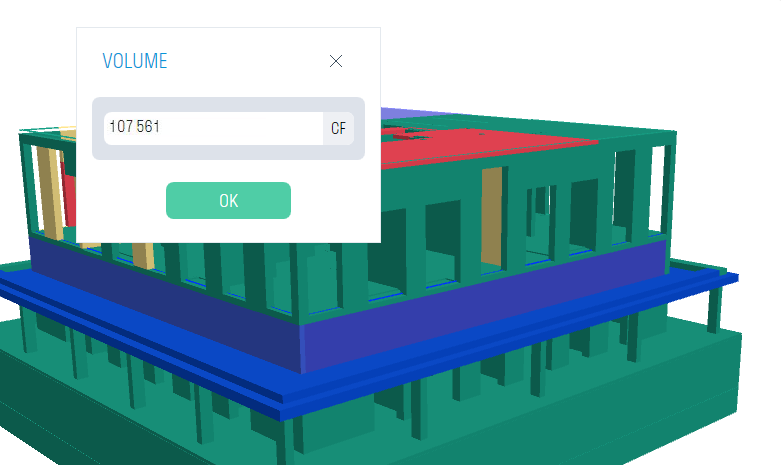
Volume/Area/Length/Count/Weight
Using the Volume, Area, Length, Quantity, and Weight commands, you can obtain values of corresponding parameters from the elements. The names of parameters from which values need to be collected are set in the SIGNAX Settings under the Quantitative Property section.
- Select the element/elements and click on the SIGNAX tab on the Calculations panel ➤ Volume/Area/Length/Quantity/Weight.
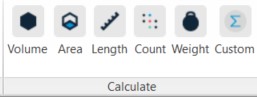
- Obtain the corresponding value.

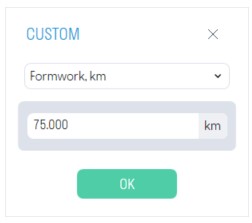
Custom
This tool allows you to obtain parameter values from elements specified in additional quantitative properties. For example, you can obtain the length of formwork in kilometers by specifying the conversion coefficient from meters to kilometers. The names of parameters from which values need to be collected are set in the SIGNAX Settings under the Quantitative Property section.
- Select the elements and click on the SIGNAX tab on the Calculations panel ➤ Custom.
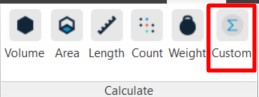
2. From the dropdown list, select the created quantitative property and obtain the corresponding value.
Color
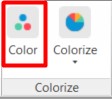


Colorize
Colorize (Set the color according to the value of the "Color" property)
Restore elements coloring according to the previously set "Color" parameter to continue working with the file in an existing .nwf or .nwd document.
Reset
The tool resets the element color to the default value. The parameters "UserColor," "Color," and "IssueColor" remain unchanged

After selecting the elements that need to reset the color (progress status), click "Reset". It will clear the value of the “Color” parameter in the “SIGNAX” tab for these elements. The element will return to its original gray color.

Photo360
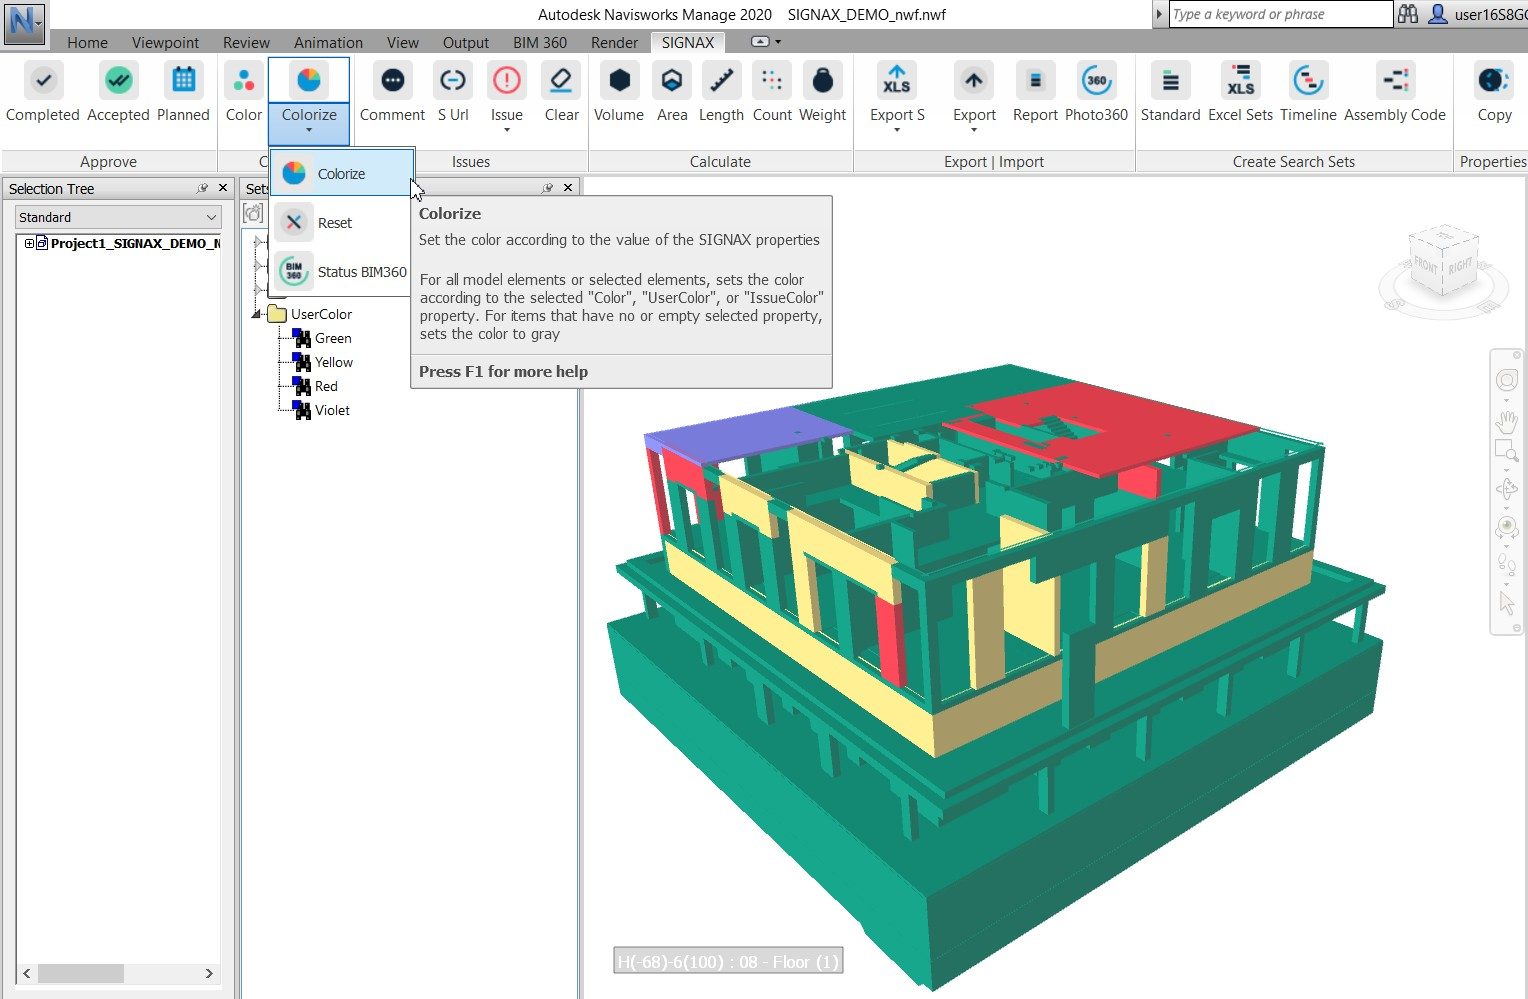
The tool allows you to export selected viewpoints as panoramic images to insert into the INSPECTION module.
- To create a viewpoint, select the location where you want to capture the panoramic photo and position your view at that location.
Attention! Make sure to align the view vertically using the align camera vertically ("Straighten") command. Otherwise, if the camera is not perfectly parallel to the ground, the stitched image will be incorrect when published in INSPECTION.
After that, you need to save the viewpoint by assigning it a name.
- Click on the SIGNAX tab on the Export | Import panel ➤ Photo360.
3. Select the required viewpoints, specify the lighting settings and the photo resolution. Then click "OK".
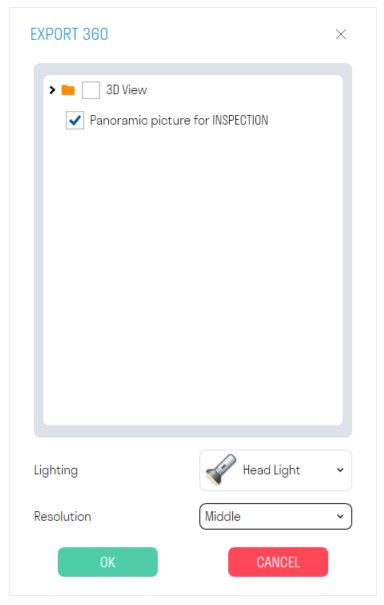
Note: If there are overexposures in the panoramic photo, it is recommended to choose a different type of lighting.
Note: The resolution of the panoramic photo affects the duration of its upload. Low - 5-10 seconds. Medium - 30-60 seconds. High - 3-5 minutes.
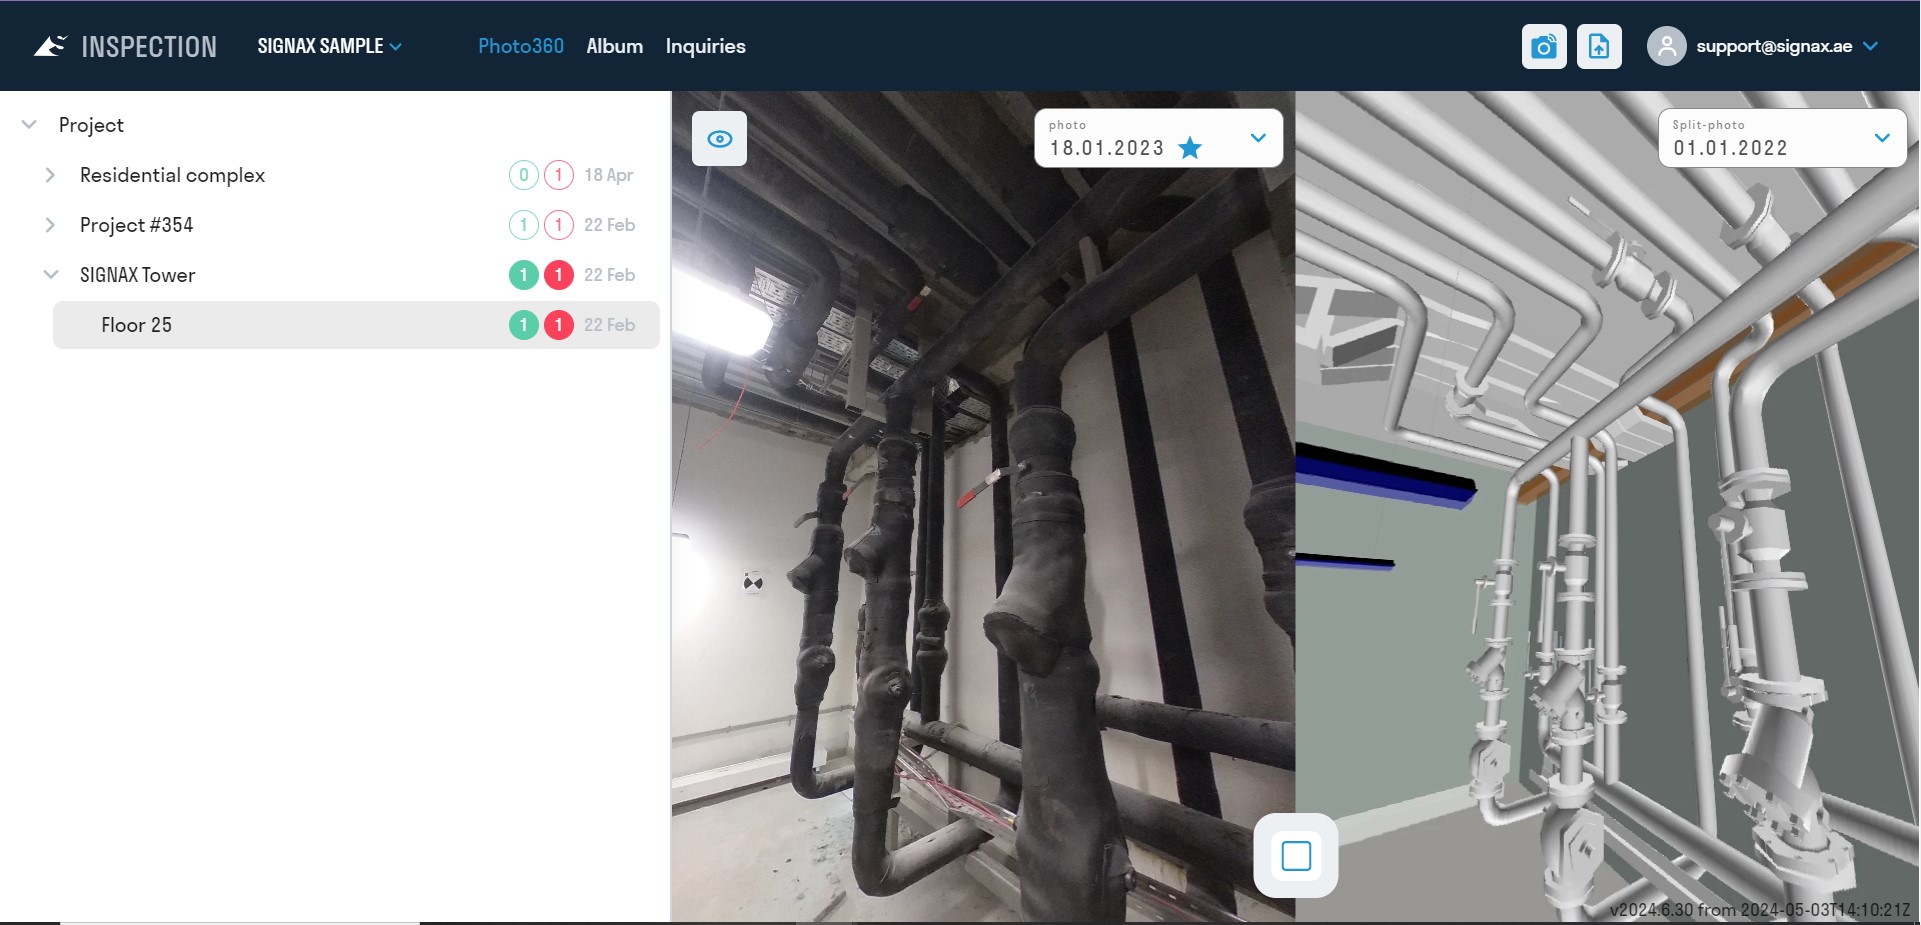
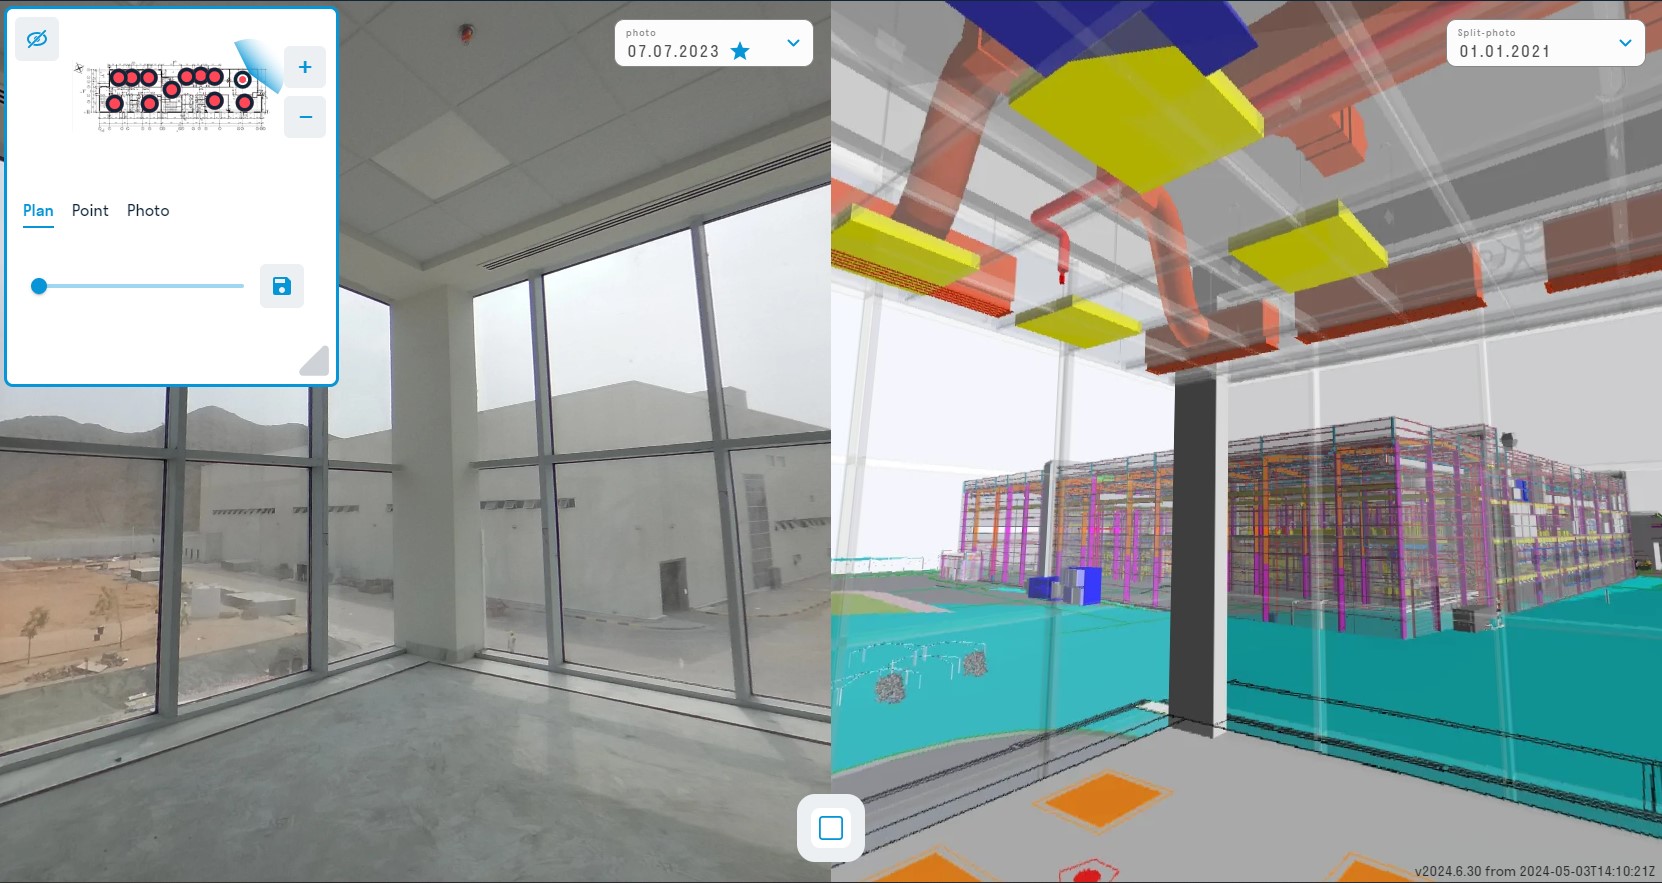
4. The resulting panoramas in .png format can be inserted into the INSPECTION module to compare them with the actual state on the construction site.
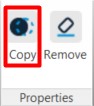
Copy
Copy - tool for transferring element parameters between tabs. Use it to switch between the previous and new SIGNAX for Navisworks versions. It also allows you to create Search Sets according to the transferred parameters.
- Click on the SIGNAX tab on the Properties panel ➤ Copy.

- Select from the list on the left the pair "Category-Property" from which the property value will be copied. Enter on the right the pair "Category-Property" to which the property value will be copied. Then click "OK".

- The "Create Search Sets" toggle allows you to create search sets.
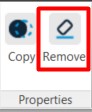
Remove
The tool allows you to delete SIGNAX properties from the selected elements.
- Select the elements and click on the SIGNAX tab on the Properties panel ➤ Remove.
- Select the SIGNAX properties you want to delete and click "OK". The plugin will remove the property values and the properties themselves

SIGNAX PRO Features
Checker
Launch Checker (SIGNAX tab)
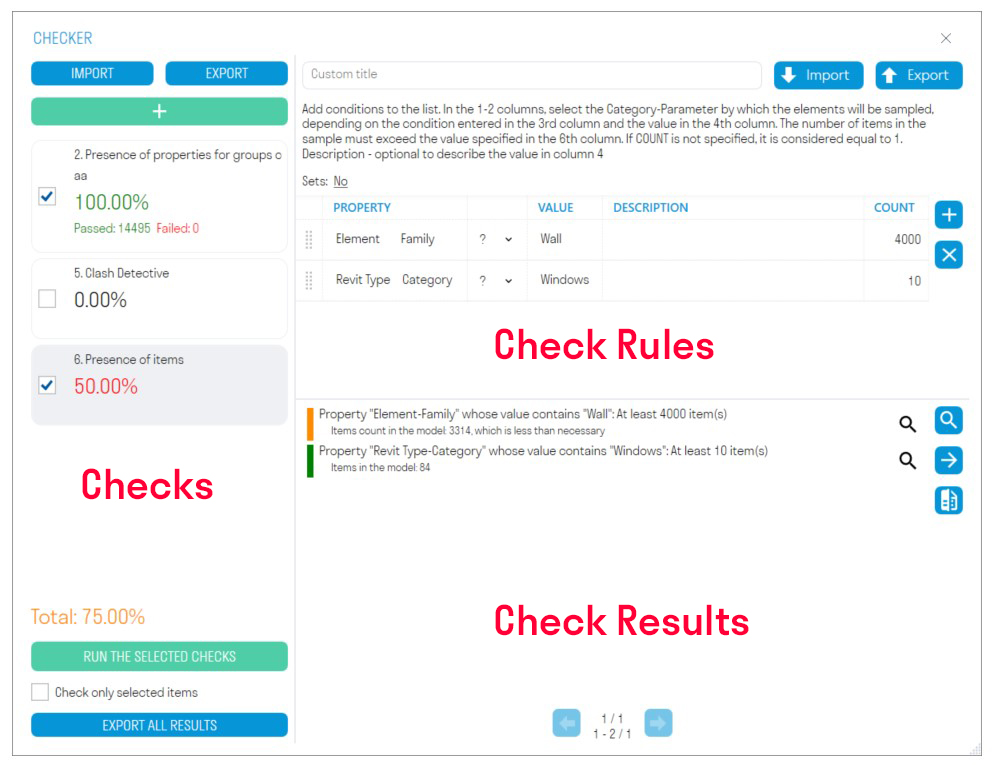
- The Checker interface is divided into 3 zones: checks, rules, and results.
1. Add one of the six checks by clicking  .
.
2. Add rules and run the check by clicking "RUN THE SELECTED CHECKS".
3. Review the elements in the model with errors to make observations. Export check results to Excel or XML. You can load XML into Revit to quickly find elements with errors and correct them. Compare results with previous check results to see which observations have been addressed.
Check Zone: This zone displays the percentage of completed checks, the number of elements that passed and failed the check.
- Press "Add Check" to add one of six checks.
- "EXPORT" allows exporting all checks with their rules to XML. You can send this file with checks to your colleagues.
- "IMPORT" allows importing an XML file with checks.
- "RUN THE SELECTED CHECKS" launches the check that has a tick next to it.
- "EXPORT ALL RESULTS" allows exporting the results of all checks into a single Excel file, which can be shared with colleagues to correct elements that did not pass the check.
Check Rules zone: where rules are created for the verification process.
- "EXPORT" allows exporting the check rules to an Excel file. You can add rules to this file and upload it back into the Checker or share it with colleagues.
- "IMPORT" allows importing an Excel file with check rules.
Check Results Zone: This zone displays the verification results in the form of element names and descriptions of why the elements did not pass the check.
- Click "Select all"
 , to highlight all elements in the model that did not pass the check.
 - Click "Search"
 next to the result to highlight one or a group of elements in the model that did not pass the check.
 - Click "Group results"
 ,,to group the check results by repeating element names and result descriptions. This reduces the number of items in the list and makes it easier to view the elements that did not pass the check in the model.
 - Click "Export results"
 , to export the verification results in Excel or XML format. XML files can be loaded into Revit using the "Check Result" command to see which elements need to be corrected based on the remarks. After correcting the remarks, you can compare this XML with new results using the "Compare" command.
 - Click "Compare"
 and upload the XML file with the results of the previous check to see which remarks have been addressed.


Adding a check.
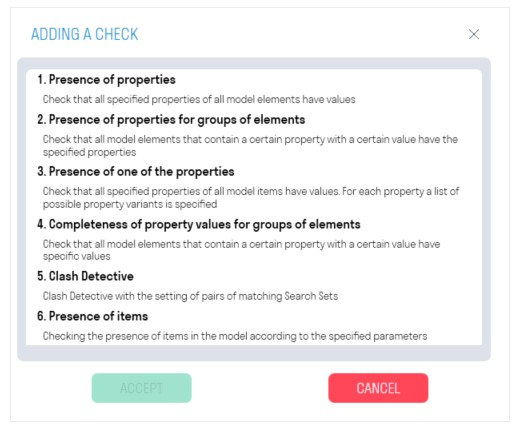
1. Presence of properties
- Checks the presence of a property value. Suitable for verifying properties that should be filled for all model elements.
- For example, let's check that the "Classification Code" property is filled for all elements.
- Add the property as a "Category-Property" pair and run the check.
- Presence of properties for the group of elements
Check that for all elements in the model containing a conditional property with a certain value, the validation properties are filled. (In this context, a conditional property is one that sets the initial condition: If the "Category" property has the value "Walls", for example. Validation properties are properties that are checked for filled values.)
- For example, let's check that the "Type" and "Level" validation properties are filled for elements with the classifier code "B1010" and "B1020".
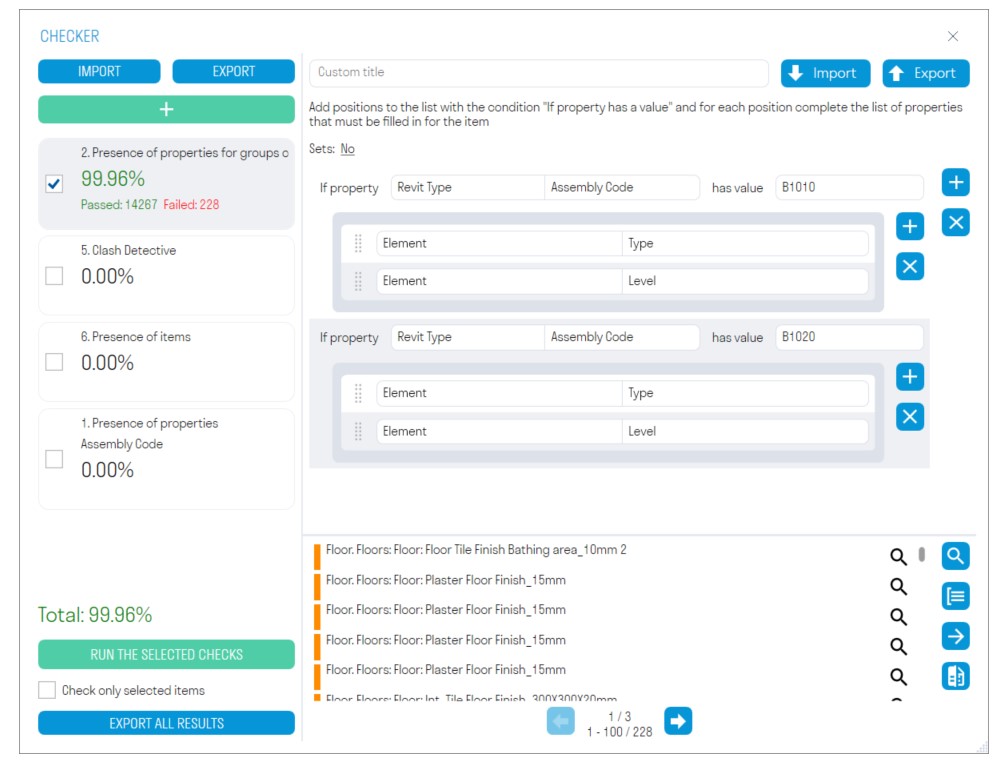
- Add a conditional property as a "Category-Property" pair and its value.
- Add validation properties as a "Category-Property" pair.

It's more convenient to create rules for this check in an Excel spreadsheet.

- In column A (Rule), list conditional properties as "Category-Property" pairs separated by a hyphen with no spaces, and in column B (Value), specify the values for these conditional properties.

- Next, starting from row 1 and column C, list the validation properties as "Category-Property" pairs separated by a hyphen with no spaces.
- Then fill in the cells in the matrix with any values, for example, "1", to link the validation property to the conditional property.
- Thus, it will be like this: "If the property "Category" has the value "Walls", then check for the presence of the properties "Name", "MP_Frame", etc."
- Presence of one of the properties
This checks if the validation property has a value, with a separate list of possible property options for each validation property. For example, when volume can be in properties like "Volume", or "Dynamo_Volume". If at least one of the options is present in the element and filled, then the validation property is considered filled.
- For example, let's check if the "Volume" property is filled for all elements.
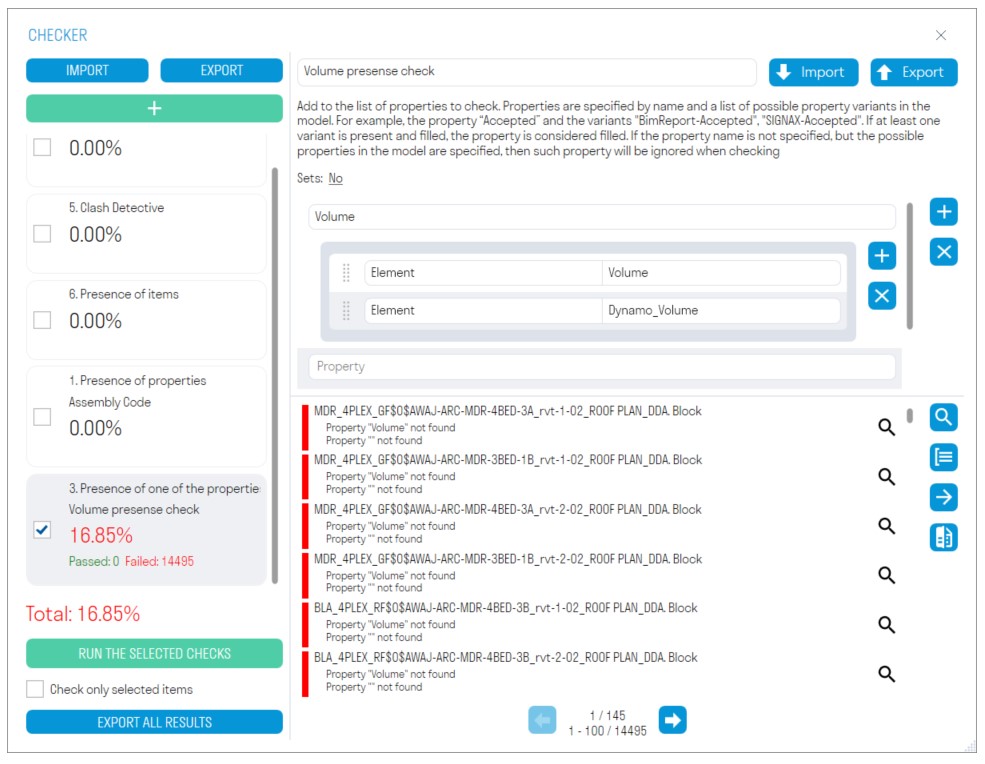
- Add a property and its list of possible options, where the element can have this property. Properties are specified as a pair "Category-Property".
- Property values completeness for groups of elements
Checks that for all model elements containing a conditional property with a specific value, the verification properties have a specific value.
- For example, let's check that for elements with a conditional property "Category" having the value "Walls", the verification property "Thickness" equals "0.020".

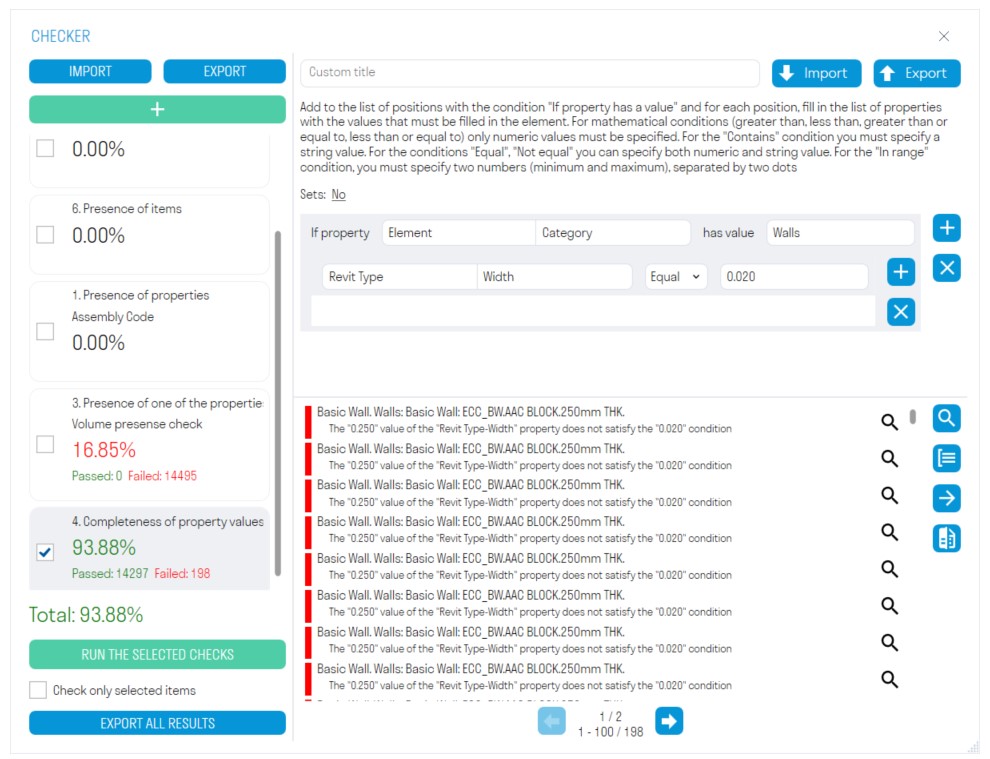
- Add a property and its list of possible options, where the element can have this property. Properties are specified as a pair "Category-Property".
- Add the verification property as a pair "Category-Property" and the value that this property should have.
- Clash Detection
Checks for clashes between created search sets. You can check elements for clashes with other elements or for self-clashes.
Create search sets with elements using the "Standard" command that need to be checked for clashes.
- In the SIGNAX settings, create "Groups of Sets" where you add search sets with elements.
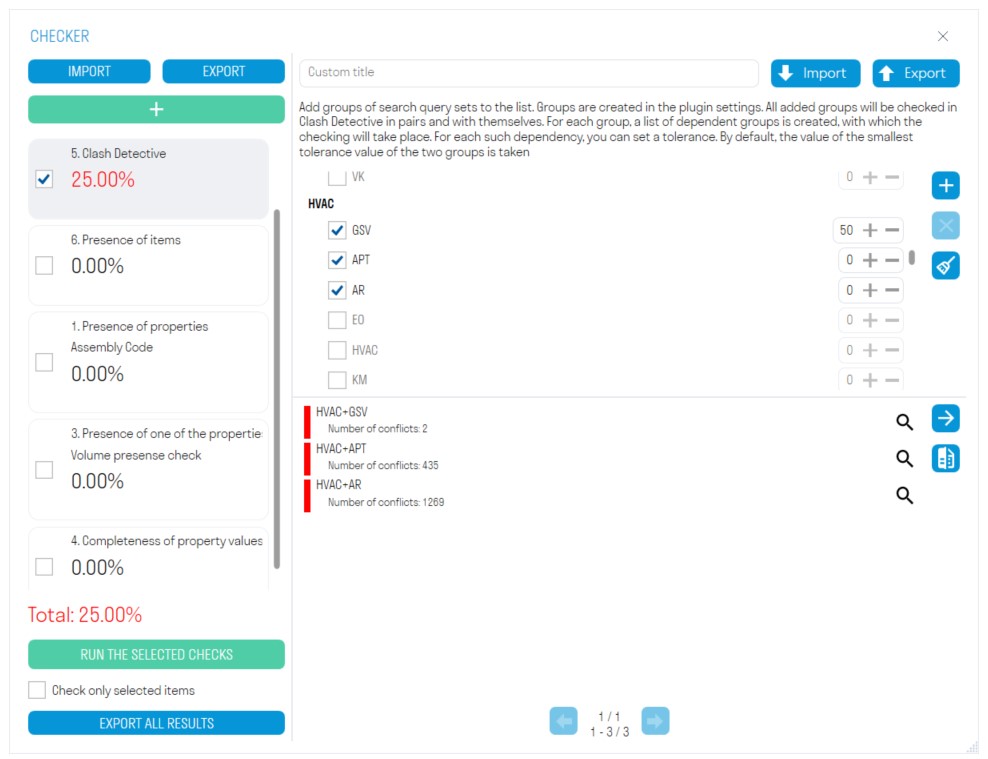
- Add the groups of sets created in the SIGNAX settings. To do this, click , select the groups, and click “OK”.


- Check the boxes for the groups you want to check for clashes and run the check. For example, Shafts with each other, Shafts with Structural elements, Structural elements with each other.
- If necessary, set the tolerance for clashes in millimeters.
- Presence of elements
Check the presence of elements in the model based on specified properties.
- For example, let's check that the model contains 50 windows.

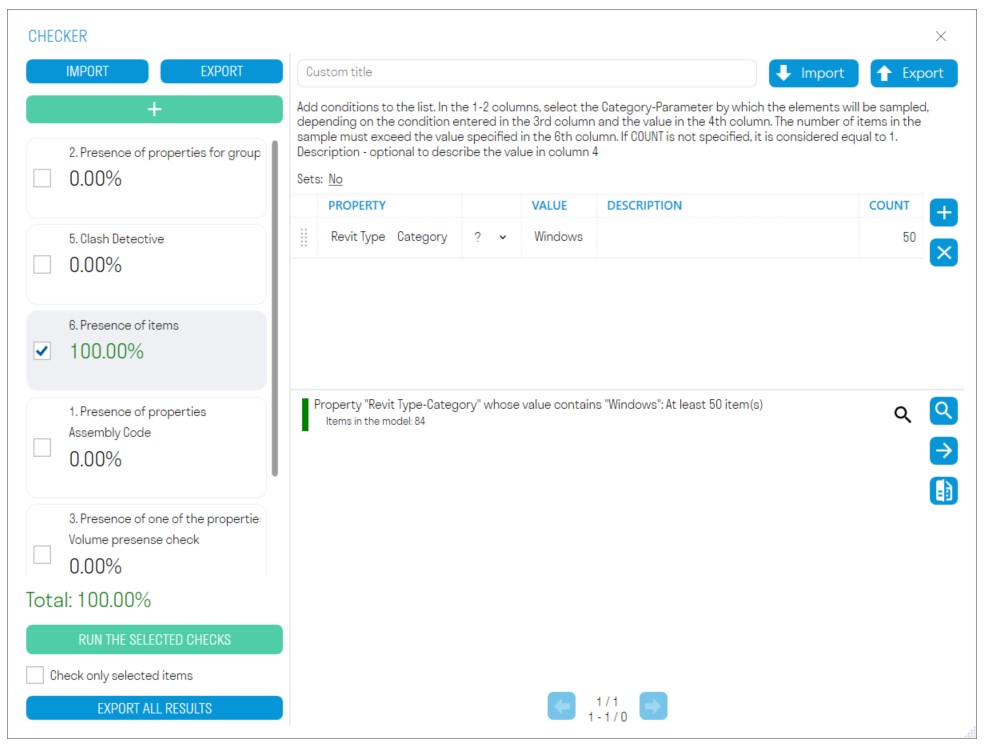
- In the "Property" column, write the property indicating the elements as a pair "Category-Property".
- In the "Value" column, enter the value of the validation property.
- In the "Description" column, you can add a description to the property.
- In the "Quantity" column, enter the number of elements that should be in the model.
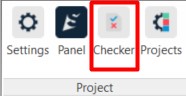
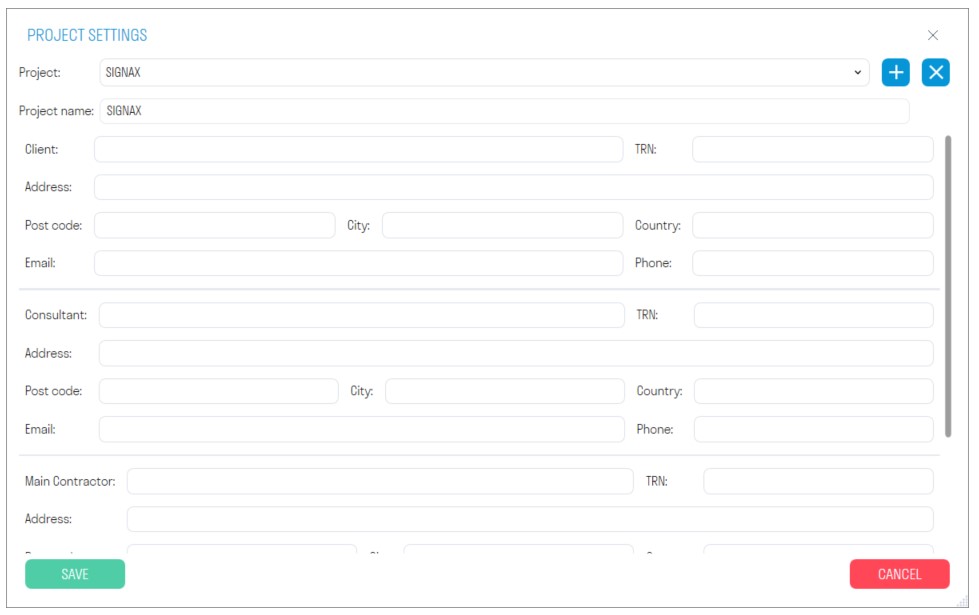
Projects
The tool allows you to create a project and enter all the necessary information for this project. It is used to export invoices.
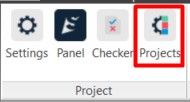
- Click on the SIGNAX PRO tab on the Project panel ➤ Projects

- A project settings window will open. Fill in the necessary information about the project, technical customer, general contractor, etc. Project data can be exported in the form of invoice.

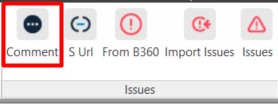
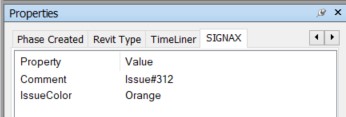
Comment
The tool allows you to add comments to an element.
- Select the elements and click on the "Comments" tab on the SIGNAX PRO panel ➤ Comment.

- Enter the comment text and click "OK".

3. After adding a comment, the following parameters will be added to the element's properties:
S URL
The tool allows adding links to elements, for example, links to issues in BIM 360 (ACC Docs) or to the manufacturer's equipment website.
1. Select the elements and click on the "S Url" tab on the SIGNAX PRO panel under Comments.
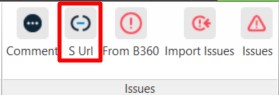
2. Paste the link into the field and click "OK".
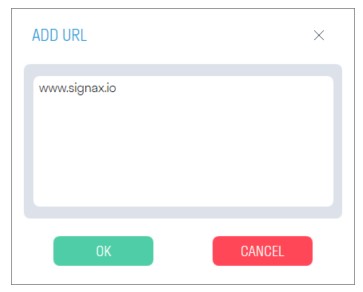
3. After adding the link, the selected element will have a new property called "S URL" with the value of the entered link in the SIGNAX tab.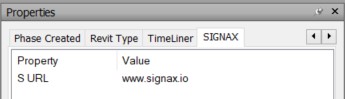
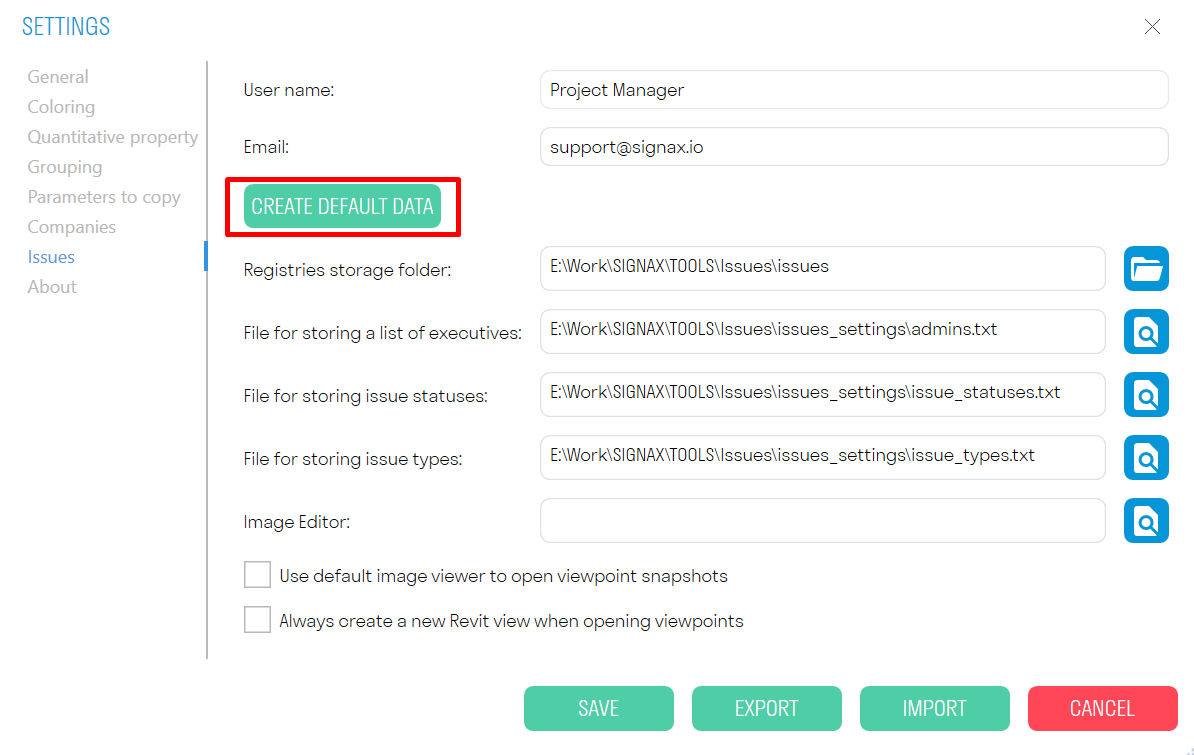
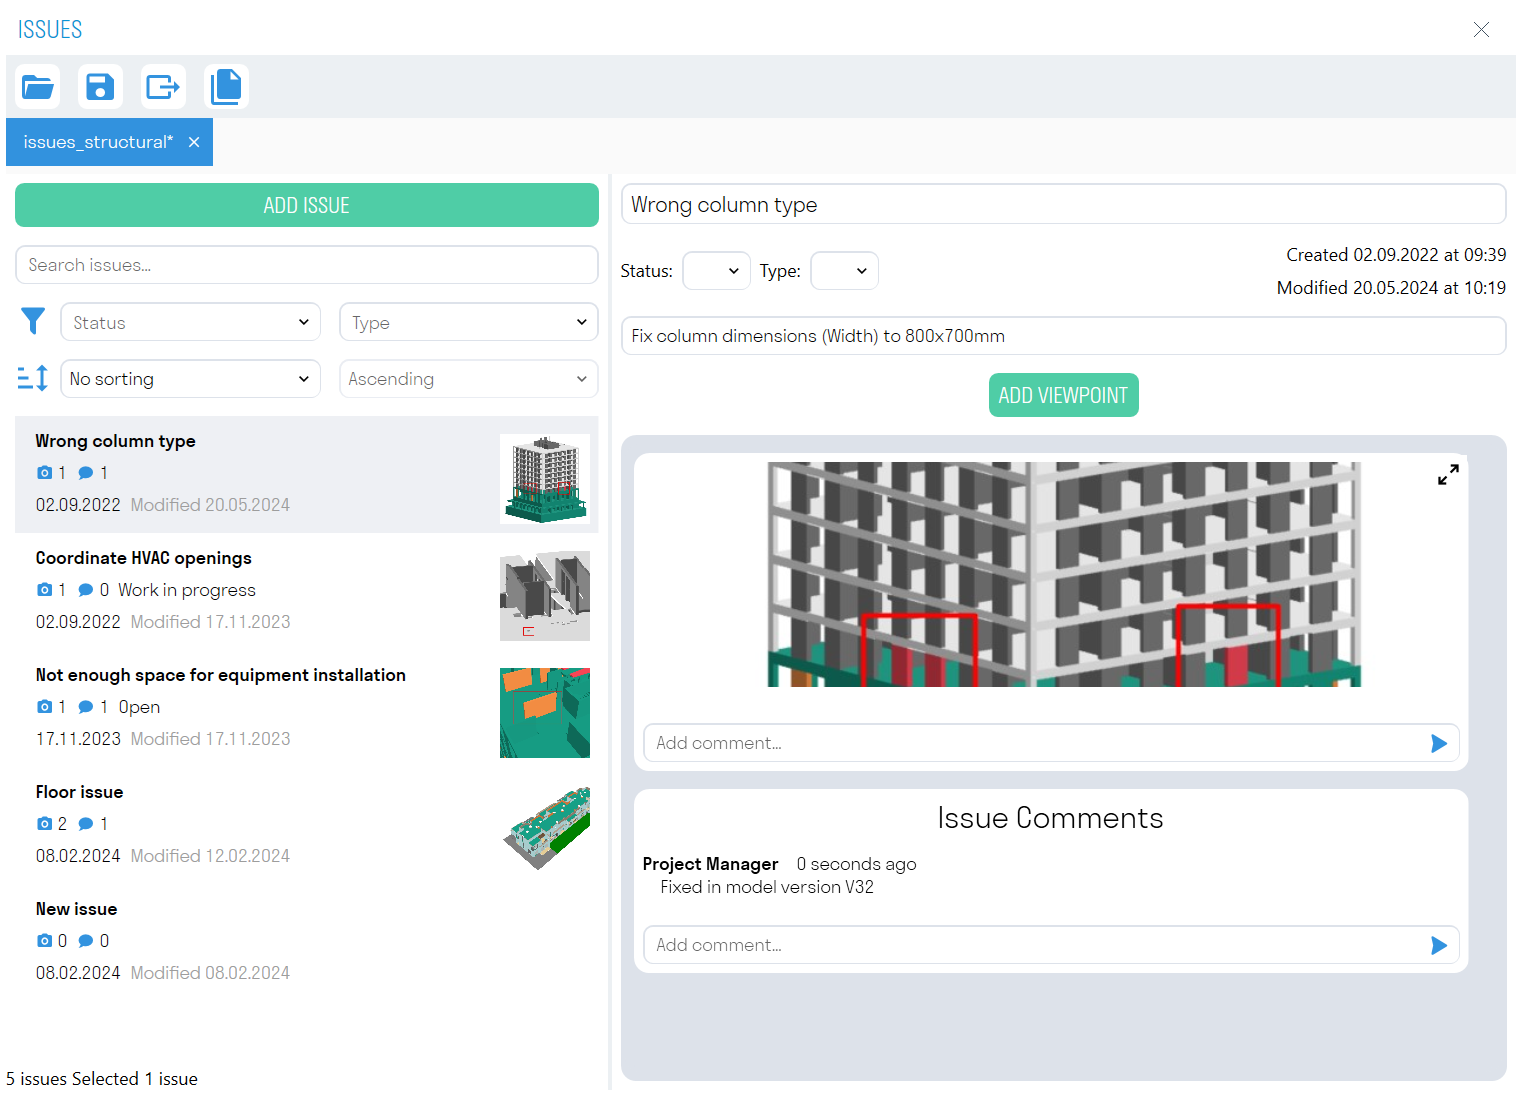
Issues
To use the BCF format Issues feature, you need to configure it in Settings. You have two options:
- Manually enter all required data - User Name, Email, Specify paths to saved .txt files with settings.
- You can also automatically "Create default data" with pre-configured .txt files. For this option, you must specify the path to the folder where the Issue settings will be stored. Later, you can edit .txt setting files and customize them based on your project requirements.
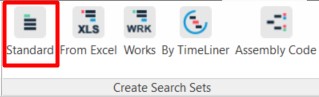
Standard
The tool allows creating search sets based on pre-configured rules specified in the "Standard Search Sets"settings.
- Click on the SIGNAX PRO tab on the Search Sets panel ➤ Standard.

- A Search Set creation window will open, where you need to specify the Excel upload option.
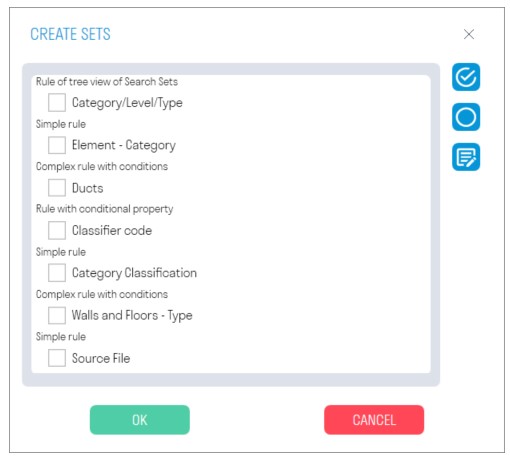
- To select all rules in the list, click
 .
. - To clear the selection of all rules, click
 .
. - To quickly navigate to the "Standard Search Sets" settings click
 .
.
- To select all rules in the list, click
- In the "Search Sets" panel, the selected search sets will be created.


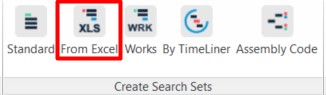
From Excel
The tool allows you to create Search Sets based on specific rules defined in an Excel file.
- Click on the SIGNAX PRO tab on the Search Sets Creation panel ➤ Sets from Excel.

- A Search Set creation window will open, where you need to specify the Excel upload option.
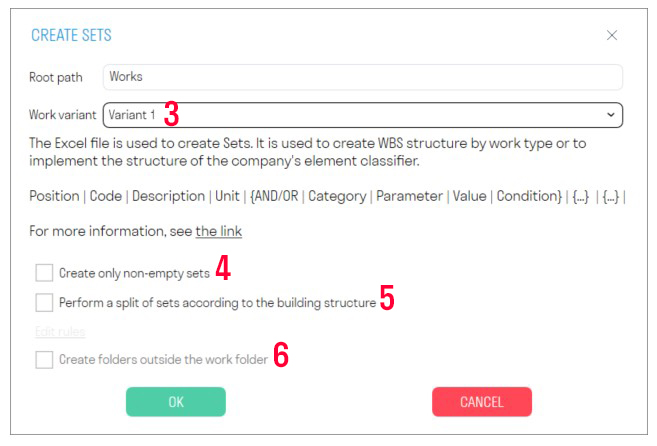
3. Options for creating search sets:
- Option 1 is used to create a structure based on types of work or the implementation of the company's element classifier.
- Option 2 differs from the first option in that the Code and Description are written in one column separated by a hyphen.
- Option 3 is used for grouping known type or size names into groups or for other value groupings into a single search set.
4. "Create only non-empty sets" - Empty search sets will not be created.
5. "Perform breakdown of sets according to object structure" - Allows additional breakdown of search sets using conditional properties.
- Check the box next to this field, then click "Edit Rules" below to configure the rules. A window with settings will open.
6. "Create folders outside of the work folder" - creates folders with breakdown by search sets one level higher than the work folders. For example, the work folder "Above Ground" will be inside a folder with the conditional property "Floor".
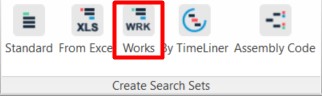
Works
The tool allows creating Search Sets based on the conditions of work types.
- Click on the SIGNAX PRO tab on the Create Search Sets panel ➤ Works.

-
Search sets will be created in the "Search Sets" panel based on the conditions specified in the work types. (see Work Types)
TimeLiner

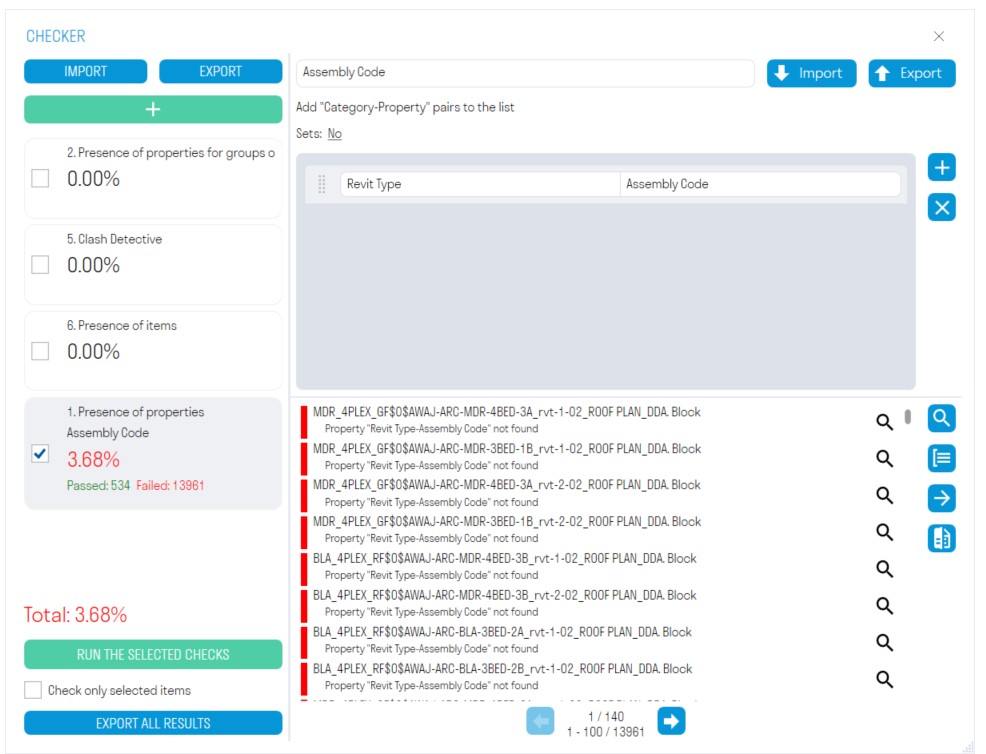
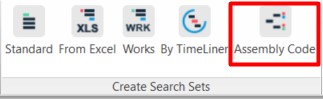
Assembly code
1. Click on the SIGNAX PRO tab on the Search Sets Creation panel ➤ Assembly Code.
2. Set up the division by classifier and click "OK".
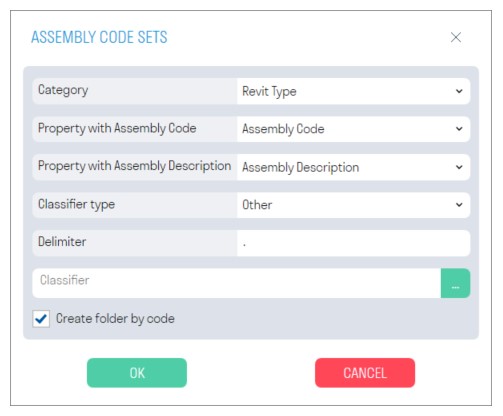
- In the "Category" row, choose the tab from the dropdown list where the property with the classifier code is located.
- In the "Property with classifier code" row, select the property where the classifier code is indicated from the dropdown list.
- In the "Property with classifier description" row, choose the property where the description of the classifier code is indicated from the dropdown list.
- In the "Classifier Type" row, choose the type of classifier from the dropdown list according to which the sets will be created. If you want to upload your own classifier, select "Other."
- In the "Delimiter" row, specify the delimiter used in your classifier. For example, a dot ".".
- In the "Classifier" row, upload your classifier in .txt format by clicking on the ellipsis. The "Create Folder by Code" toggle creates a separate folder for each code.
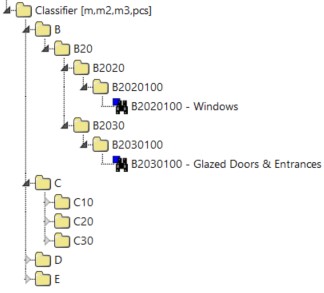
3. Afterward, sets with division by classifier code will be created in the "Search Sets" panel.
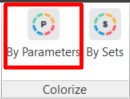
By Parameters
The tool allows coloring model elements according to specified properties.
- A window with coloring settings will open. Add properties manually or import an Excel file, then click "OK".
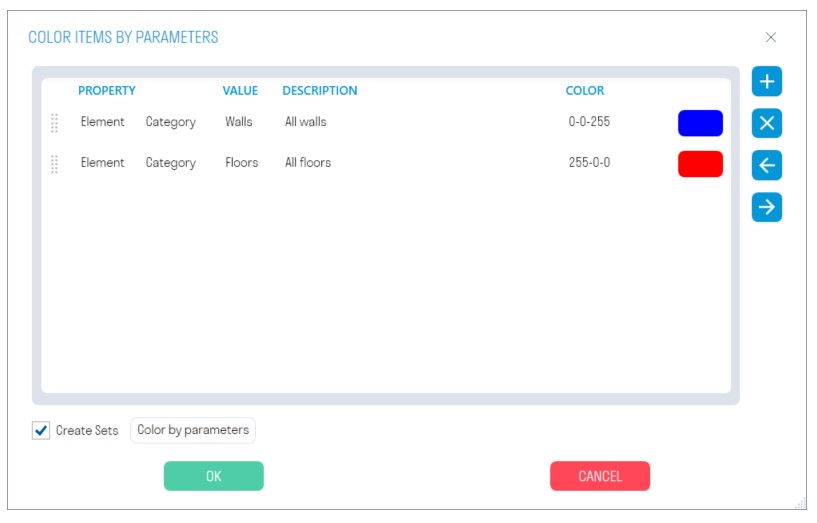
In the "Property" column, specify the pair "Category-Property".
- In the "Value" column, specify the value of the property by which the elements should be colored.
- In the "Description" column, provide a description for the search sets.
- In the "Color" column, specify the color in which the elements should be colored. The color is specified in RGB format separated by dashes, for example, "252-82-3".
- The "Create Search Sets" toggle allows you to create search sets based on the specified properties. Specify the folder name.
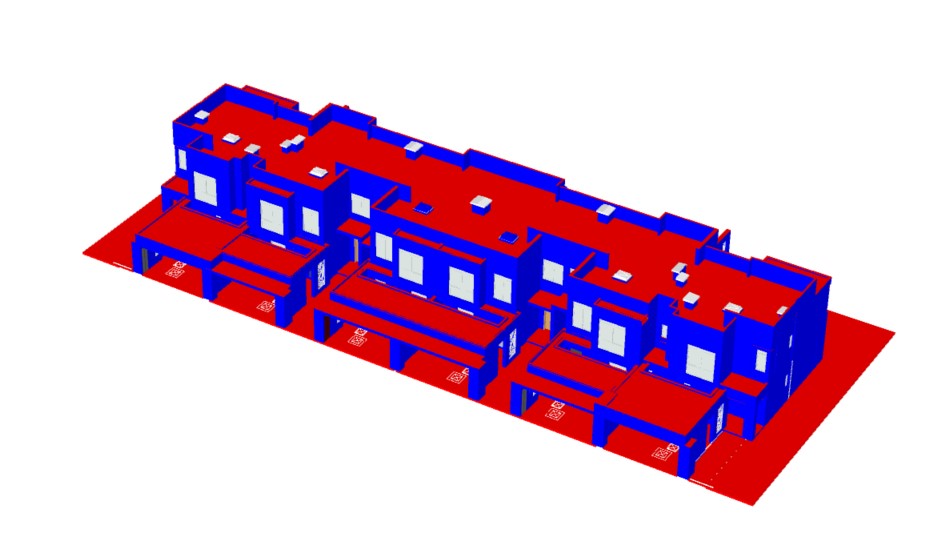
3. After assigning the color, elements in the model would change their color:
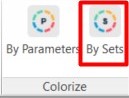
By sets
The tool allows you to color elements in the model based on pre-created search sets.
- Click on the SIGNAX PRO tab on the Coloring panel ➤ By Sets
- A window with coloring settings will open. Click
 , to add a search set.

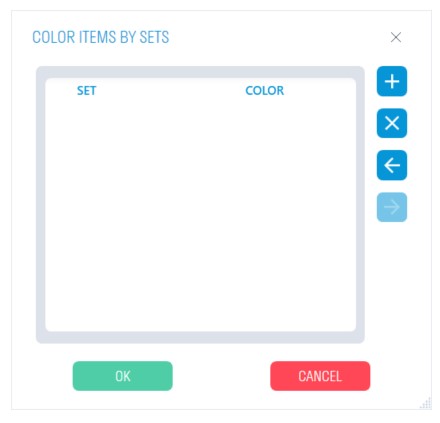
- From the list, choose the pre-created search set and click "OK".
- In the "Color" column, specify the colors to paint the elements, then click "OK". Colors are specified in RGB format separated by dashes, for example, "252-82-3".
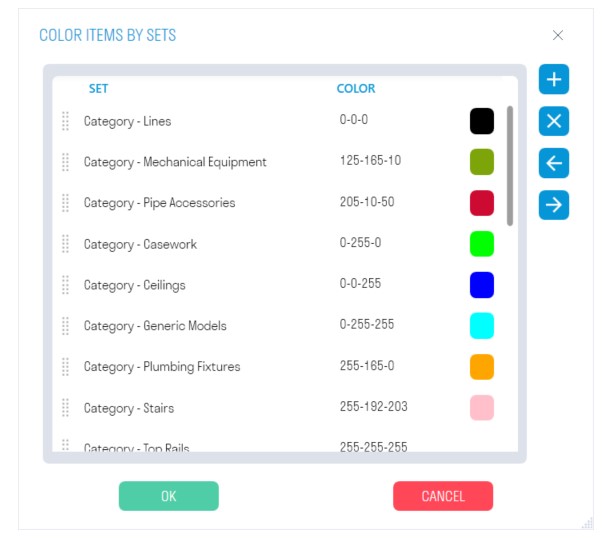
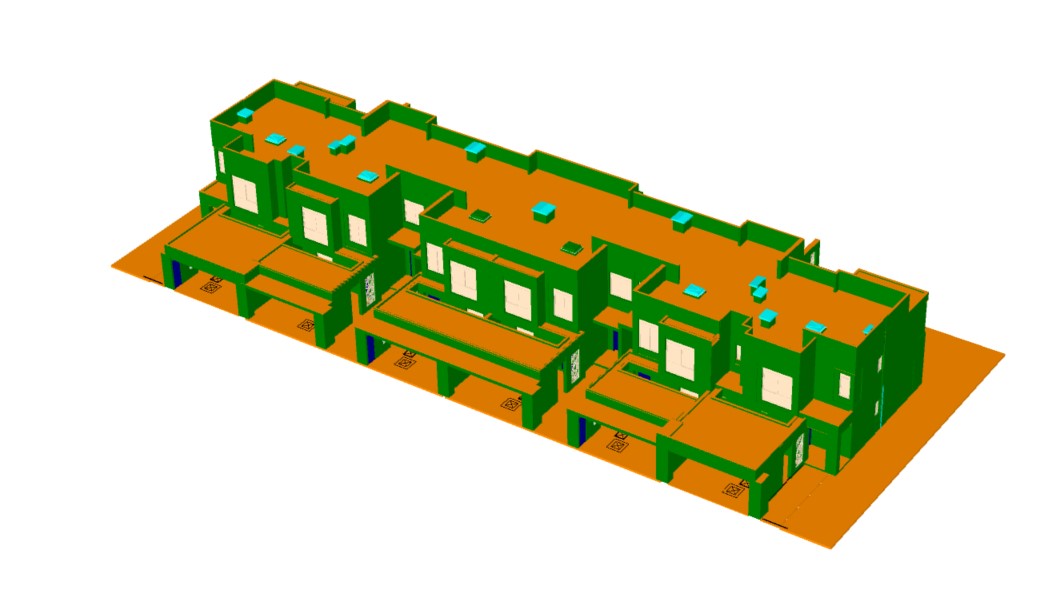
- The elements will be colored according to the specified colors.
Export S

Export S- Export all “SIGNAX” tab parameters to Excel.(select the elements you need)

Import S
Import S - Import all “SIGNAX” tab parameters to Excel.(select the elements you need)
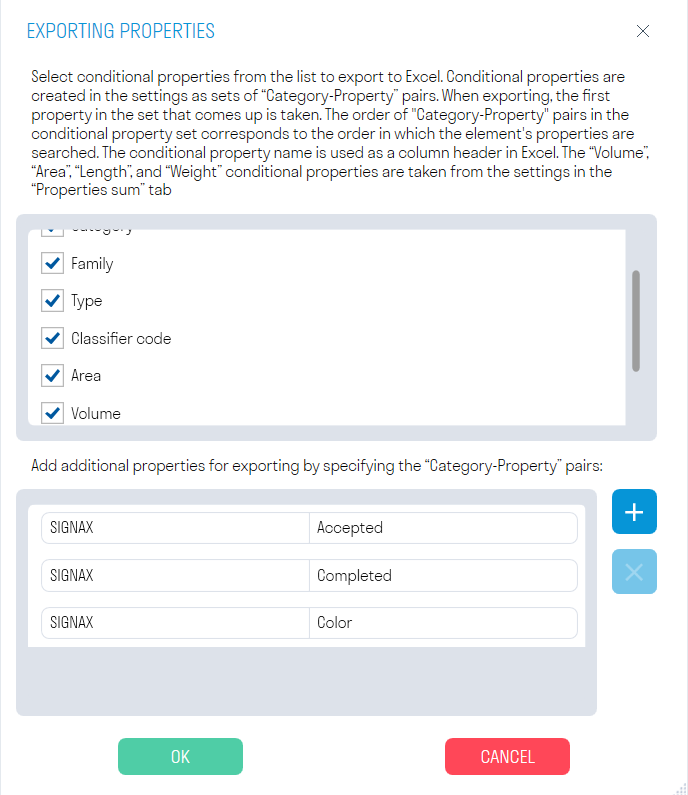
Export ALL
Export - Export/Import of all elements with a standard set of parameters + additional parameters to Excel.
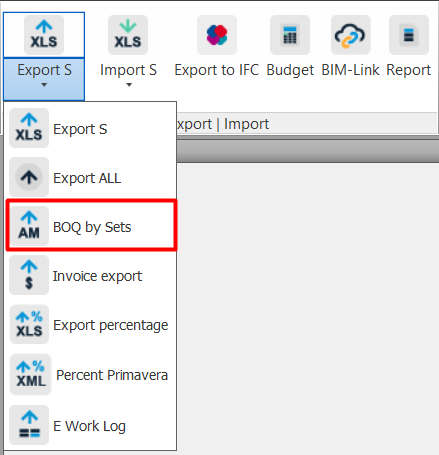
BOQ by sets
The feature allows you to export scopes (m3, m2, m, kg, pcs) to Excel based on search sets. For example, you can export the search set "Completed" and check the volume of completed items.
-
Click on the SIGNAX PRO tab in the Export | Import panel ➤ BOQ by sets.
-
A window with export settings will open. From the drop-down list, select the previously created folder with search sets and click "OK."

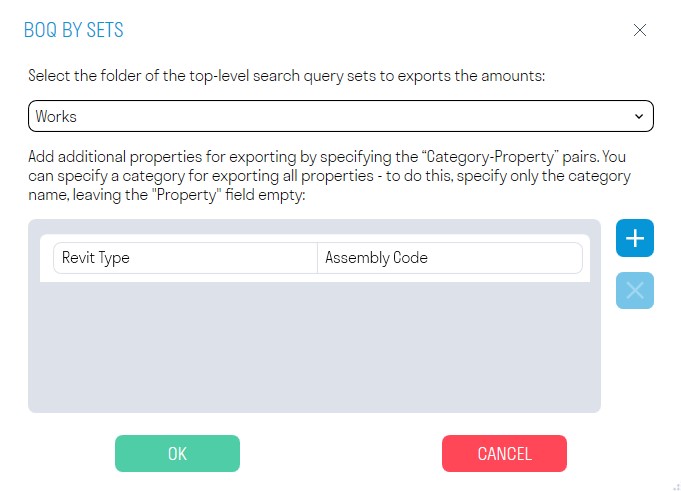
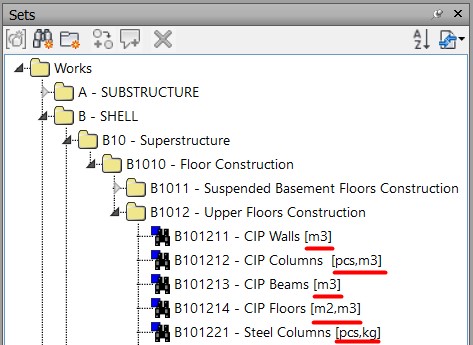
- To export volumes, the search set name must contain measurement units in square brackets, for example, [m3, m2]. Multiple units of measurement are separated by commas.
- You can add additional properties in the form of a "Category-Property" pair at the bottom of the window.
Note: Search sets can be created using the "Standard" tool.
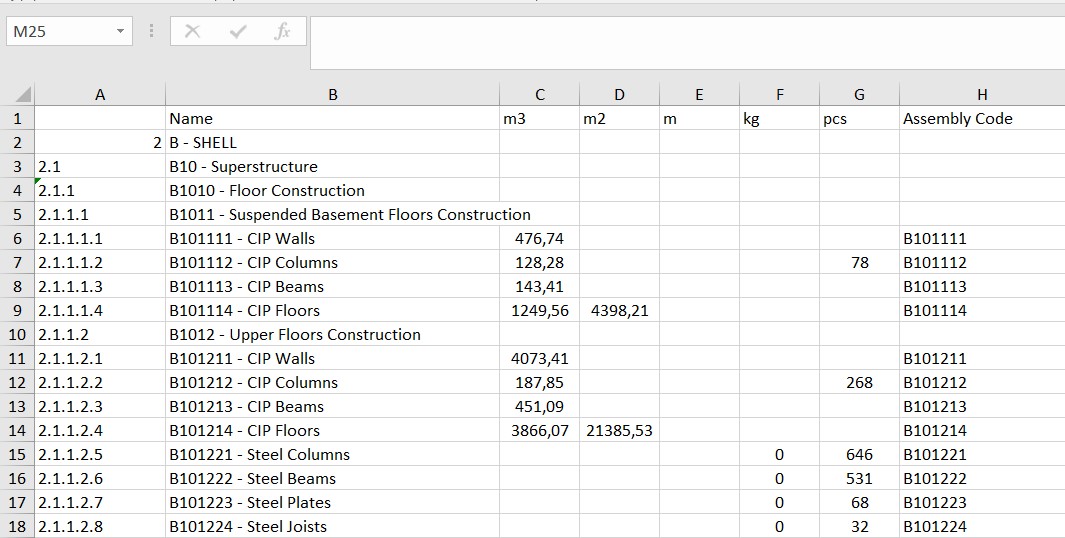
- An Excel file with search sets and volumes will be exported.
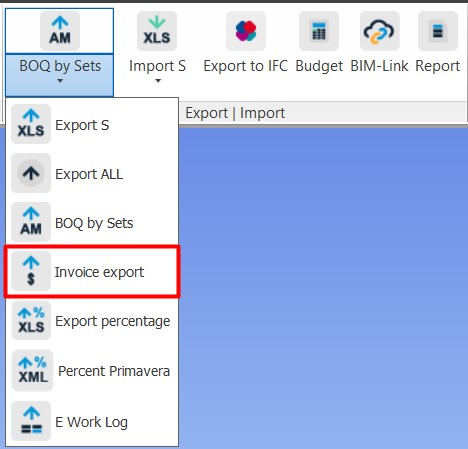
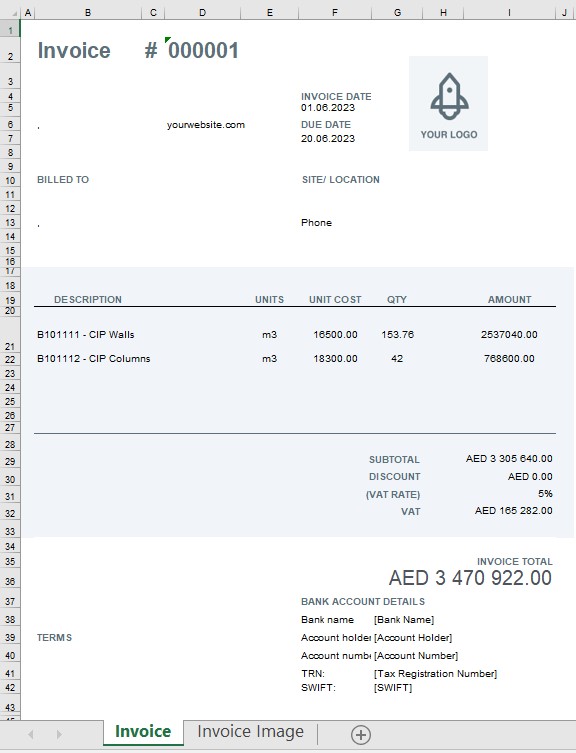
Invoice export
The feature allows you to export Invoices with references to the activities and scopes from the BIM model.
-
Click on the SIGNAX PRO tab in the Export | Import panel ➤ Invoice export.
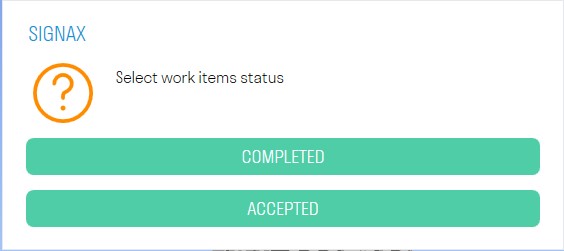
-
Choose the status of activities that need to be exported to Invoice.

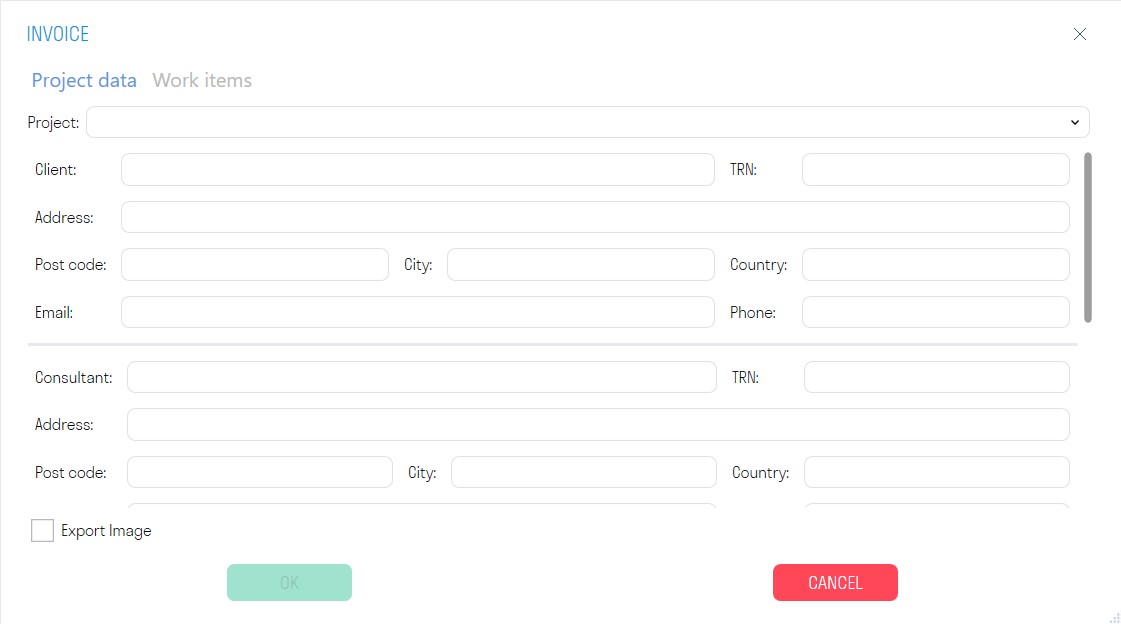
-
The export settings window will open.

Under the "Project data" tab, select the pre-created project from the dropdown list.
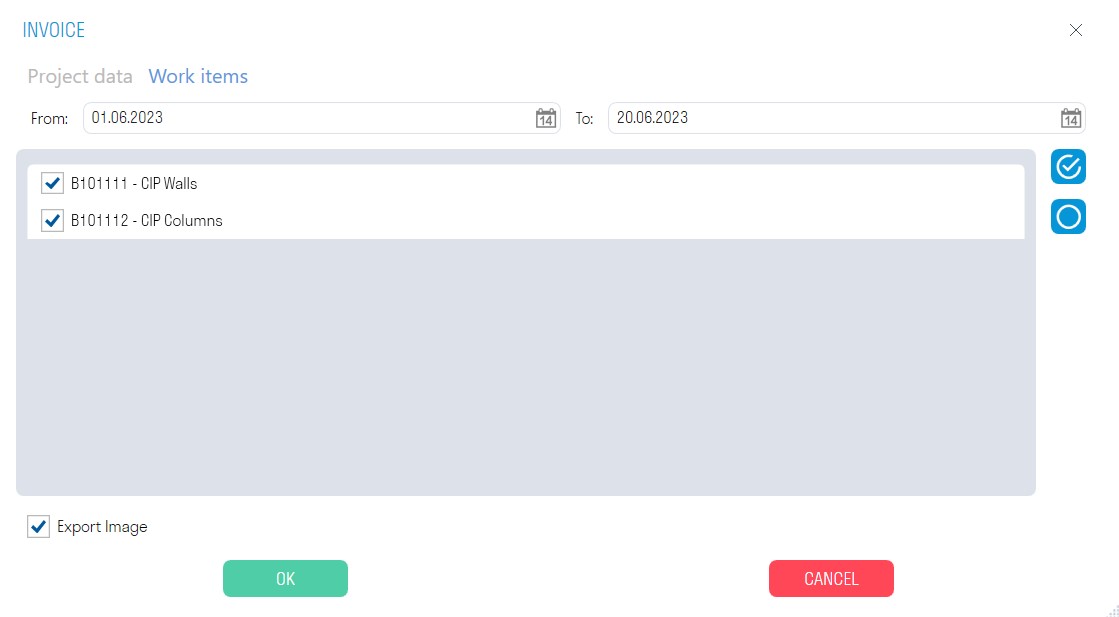
Under the "Work items" tab, choose the period of activity execution and the specific types of activities. Then click "OK."

The "Export Images" switch allows you to export images of elements executed during the specified period.
- An Excel file in the Invoice form and images of elements will be exported.
Export Percentage
The feature allows you to export scopes of activities to Excel with the calculation of the percentage of completed activities.
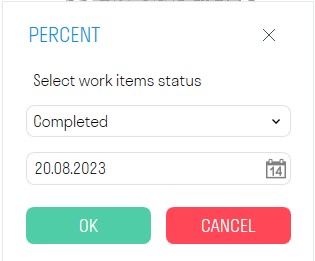
- Click on the SIGNAX PRO tab in the Export | Import panel ➤ Export Percentage.
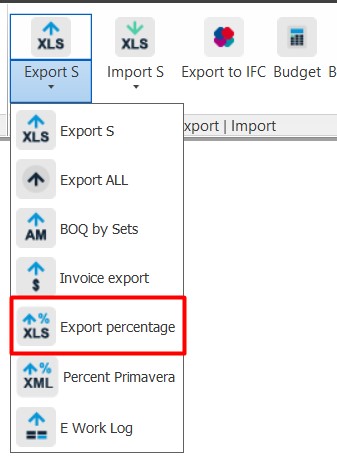
- Select the status of activities and the date of their completion, then click "OK."
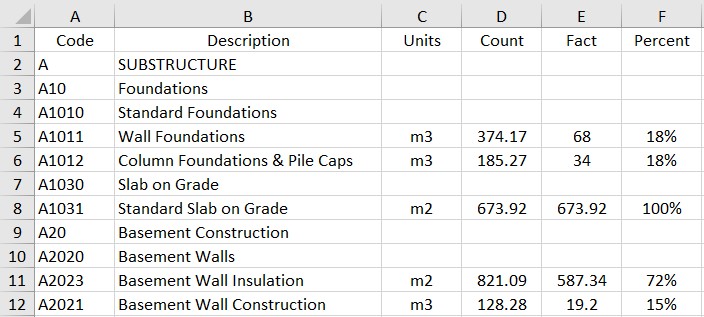
- To do this, make sure you have a search set "Works" created in the "Sets" panel with properly filled conditions. You can create the search set using the "Works" tool.

- Completed activities are marked using the "Finish or Accept" tool.
- An Excel file will be exported containing the volumes of activities, actual volumes, and the percentage of completed activities.
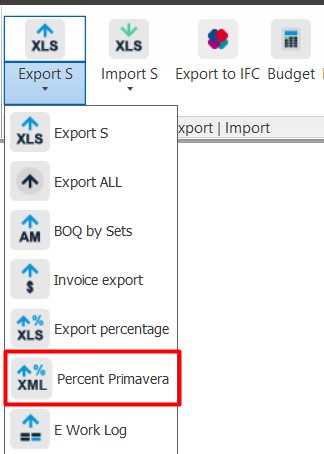
Percent Primavera
The feature allows you to export the percentage of completed activities to an XML file originally exported from Primavera.
Usage Algorithm: After exporting activities from Primavera in XML format, import them into "Tools for Navisworks" using the "Import from Primavera" command (see Work types). Then, mark the dates of activity completion using the "Completed/Accepted" commands. Now, you can load the percentage of completed works back into the same XML file using the "Percentage Primavera" command. Finally, import the XML file back into Primavera to observe the percentage of completion.
- Click on the SIGNAX PRO tab in the Export | Import panel ➤ Percent Primavera.
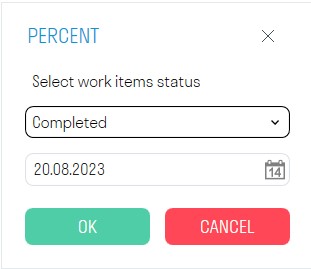
- Select the status of activities and the date of their completion, then click "OK."
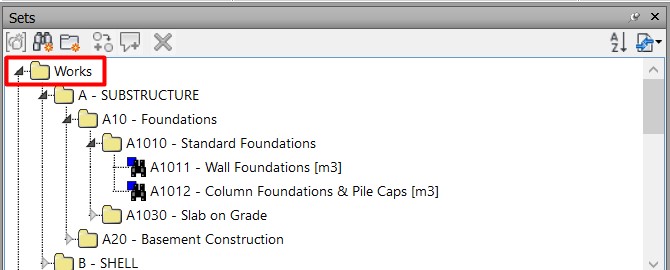
Make sure you have a search set "Works" created in the "Sets" panel with properly filled conditions. You can create the search set using the "Works" tool.
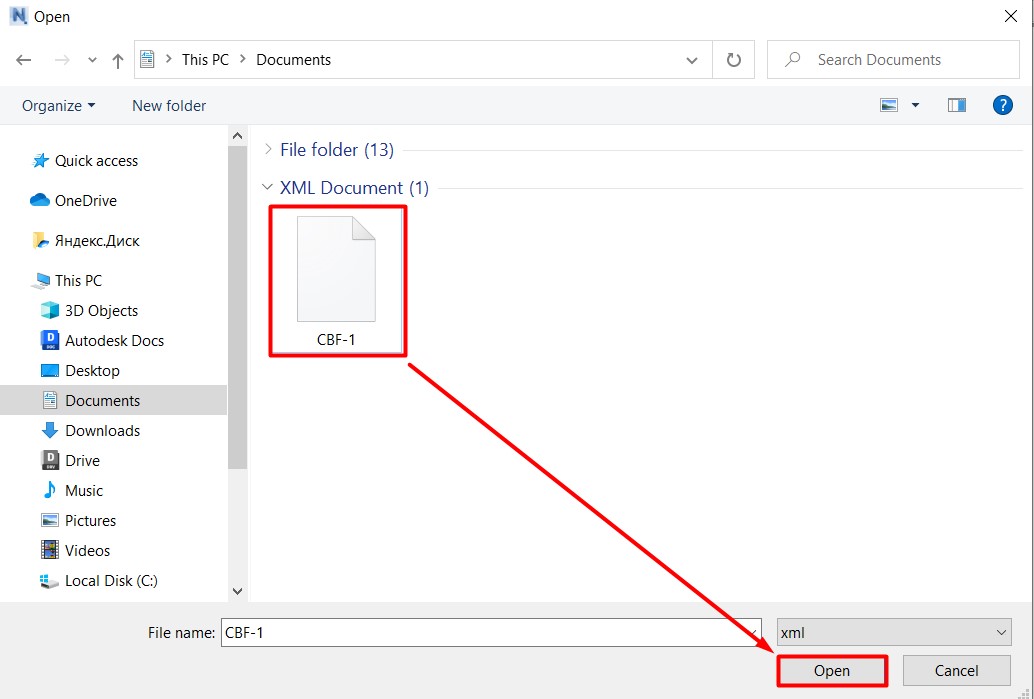
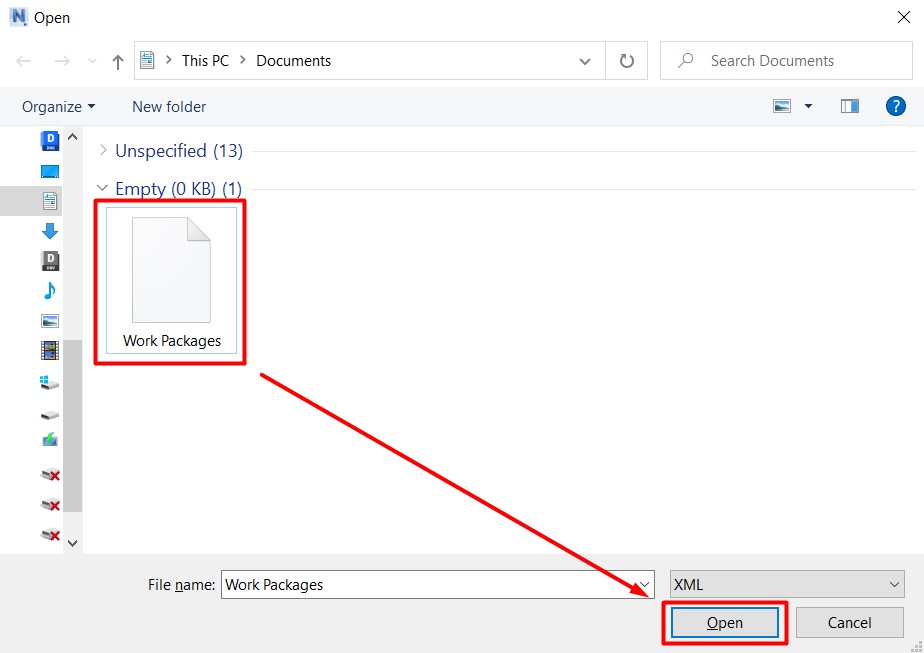
- Choose the XML file previously exported from Primavera and click "Open."
- The percentage will be recorded in the specified XML file. Now, you can load it back into Primavera.
E Work Log
The feature allows you to export activities to Excel with a breakdown of volumes and their execution dates. For example, a construction site manager can cross-reference their daily paper-based work log with the exported data from the BIM model.
1. Click on the SIGNAX PRO tab in the Export | Import panel ➤ E Work Log.
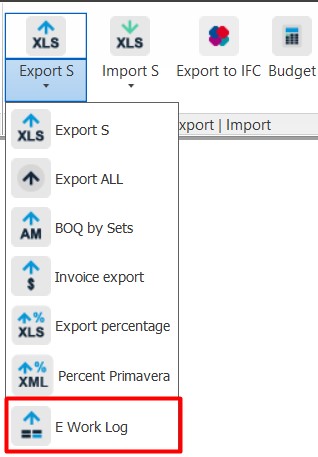
2. Choose from the dropdown list the status for which you want to export volumes: Accepted or Completed. Make sure corresponding search sets, "Accepted" or "Completed," have been created in the "Sets" panel.
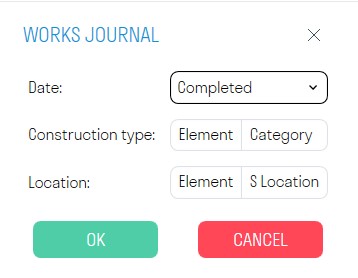
- Additionally, you can further categorize the data by "Construction Type" and "Location" by specifying corresponding "Category-Property" pairs.
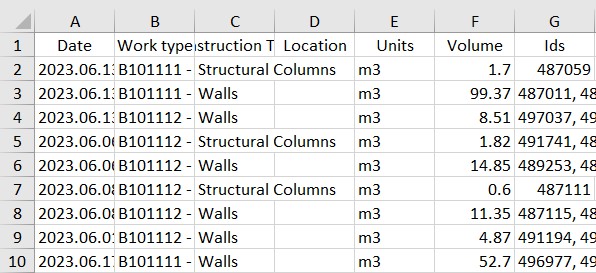
3. An Excel file will be exported containing the execution dates of the activities, the activities themselves, breakdown by categories and levels, the volume of completed activities, and the IDs of the elements included in the specified activities.
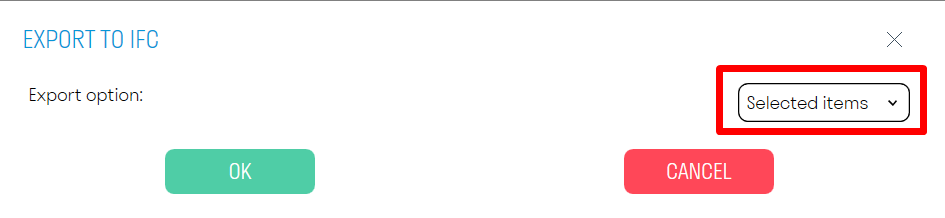
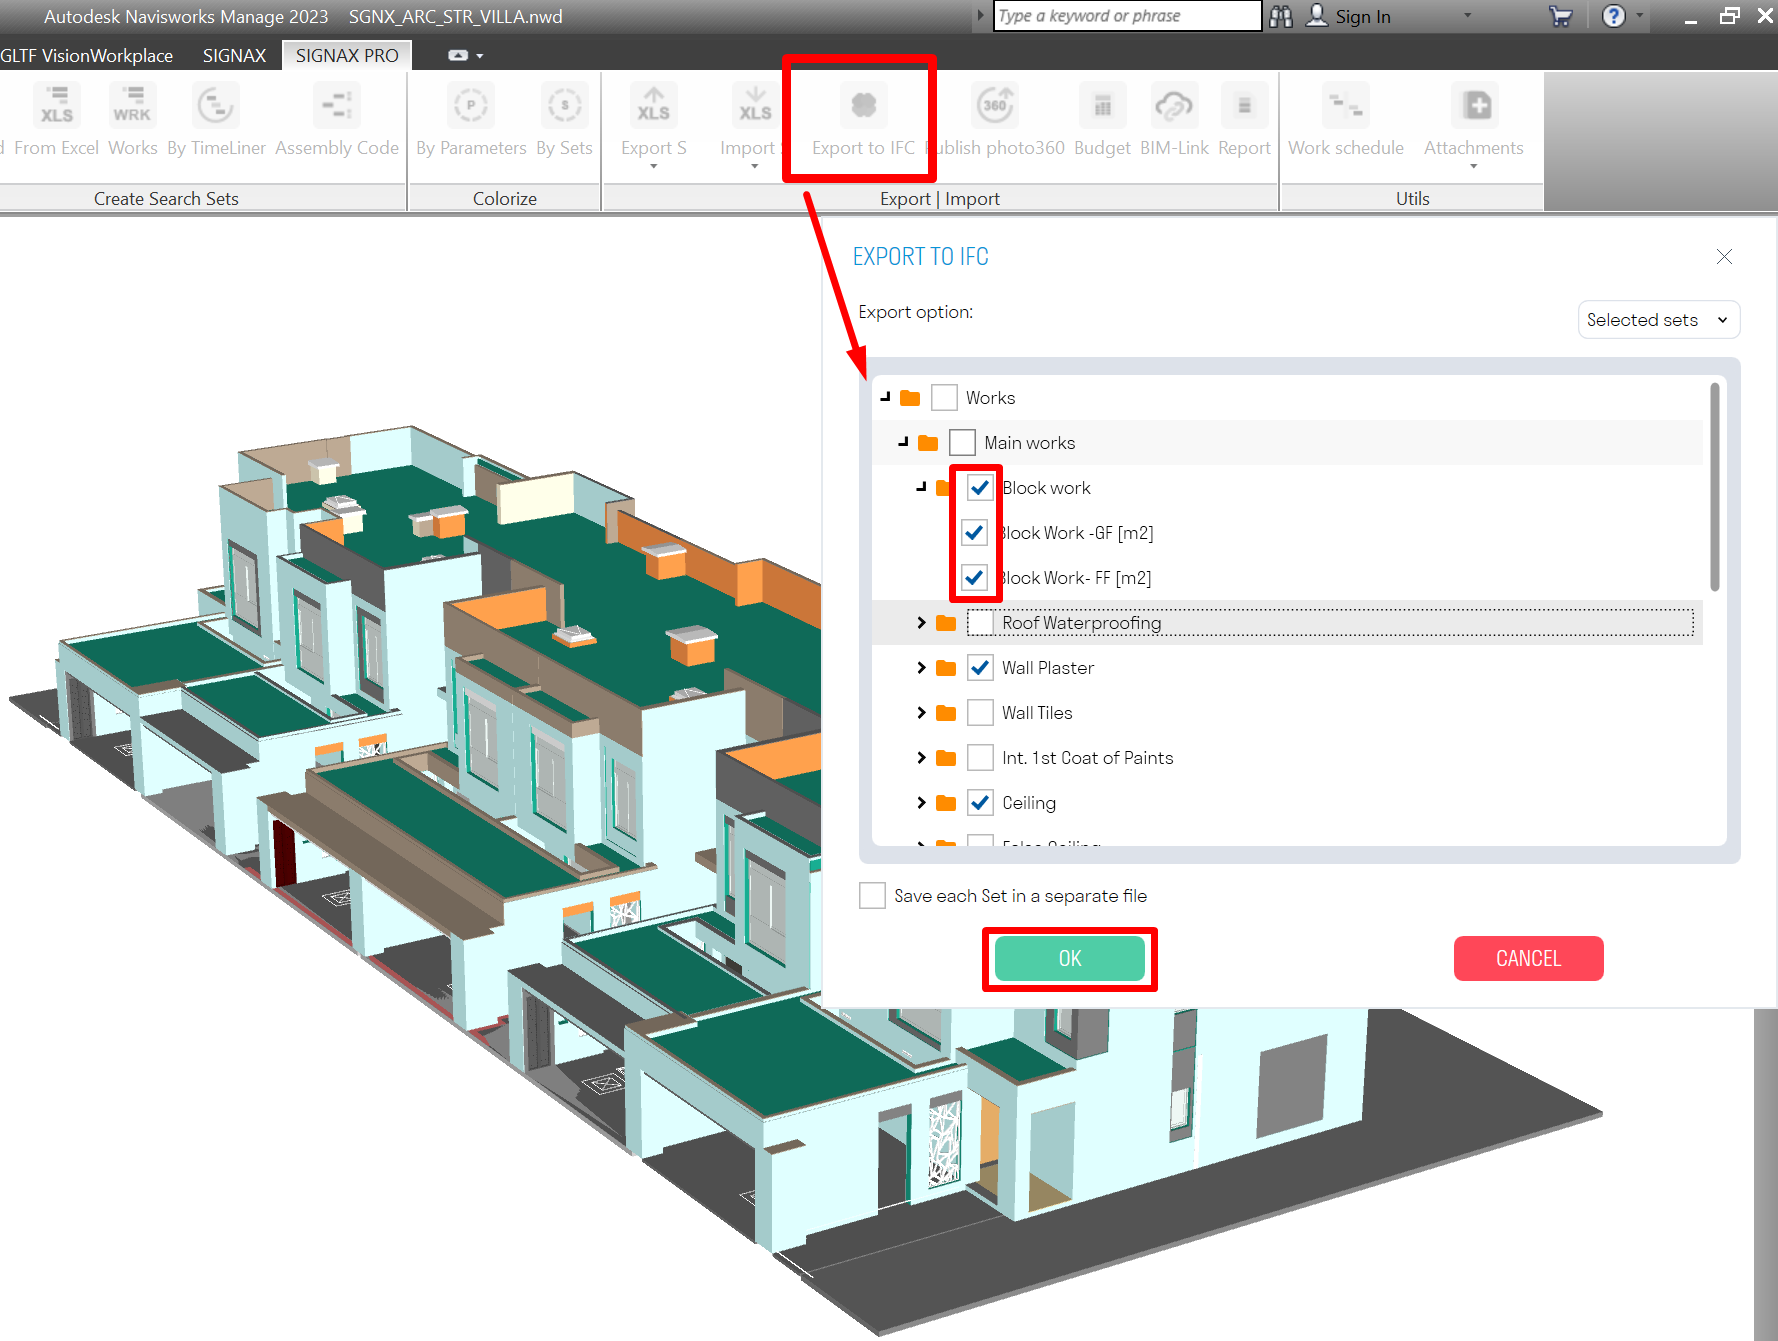
Export IFC
SIGNAX TOOLS allows you to export Navisworks file to IFC format.
There are three options to do that:
- Export selected on 3D view items
- Export created search set
- Export multiple search sets (with an option to save them as separate files.
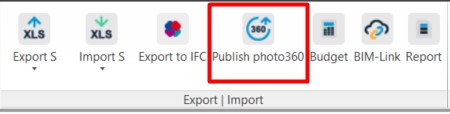
Publish photo360
The tool allows you to upload viewpoint snapshots from Navisworks to the INSPECTION service for comparing the model with the actual state of the construction site. Admin rights in the INSPECTION service are required to upload photos.
- First, create viewpoint snapshots in Navisworks. To create a viewpoint snapshot, select the location where you want to capture the panoramic photo and position your view at that location.
Attention! Make sure to align the view precisely vertically using the "Align Camera Vertically" command. Otherwise, if the camera is not strictly parallel to the floor, the stitched image in INSPECTION will be incorrect.

After that, you need to save the viewpoint, giving it an appropriate name. It is recommended to follow the BLOCK-FLOOR-POINT structure for automatic matching of viewpoints with INSPECTION points (see step 4).
- Click on the SIGNAX PRO tab on the Export | Import panel ➤ Publish photo360.
4. In the opened window, expand the necessary plan in the left part, and in the right part, match the point from INSPECTION with the viewpoint from Navisworks by selecting the latter from the list in the "Viewpoint" column.
For automatic matching of viewpoints with points from INSPECTION, click on DETERMINE at the top of the window.
Viewpoints will be filled automatically provided that the location of the viewpoint in the tree corresponds to the location of the point in INSPECTION, i.e., the structure of the tree is consistent with BLOCK-FLOOR-POINT.
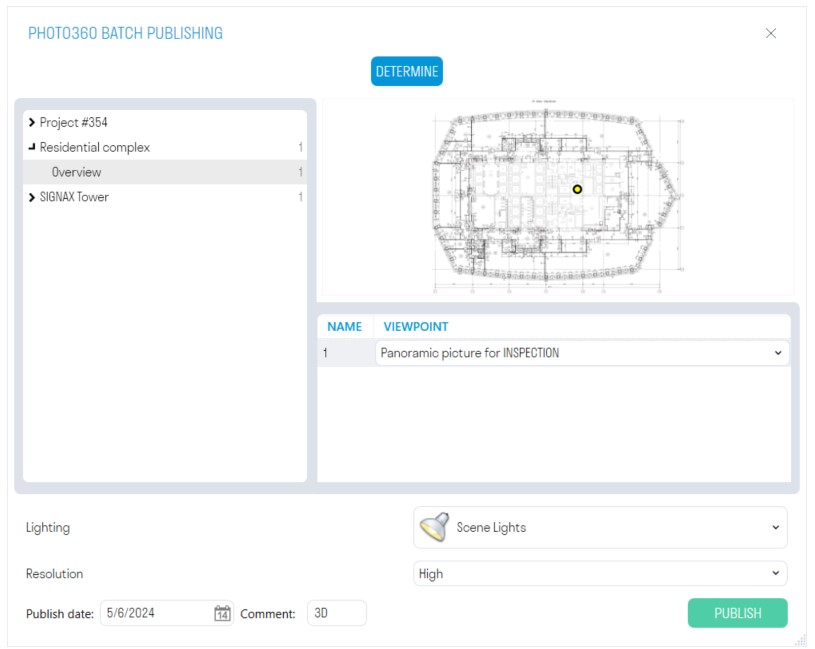
5. Select the Lighting Type. If there are overexposures in the panoramic photo, it is recommended to choose a different lighting type.
6. Choose the Resolution. The higher the resolution, the longer it will take to export the panoramic photo. Low - 5-10 seconds. Medium - 30-60 seconds. High - 3-5 minutes.
7. Specify the Date of Photo Publication and, if necessary, a Comment. The comment is displayed in the photo list of the INSPECTION service, necessary for identifying photos exported from the model, and is limited to five characters.
- Click on "Publish" and wait for the photos to finish uploading to the INSPECTION service.
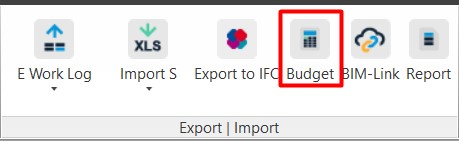
Budget
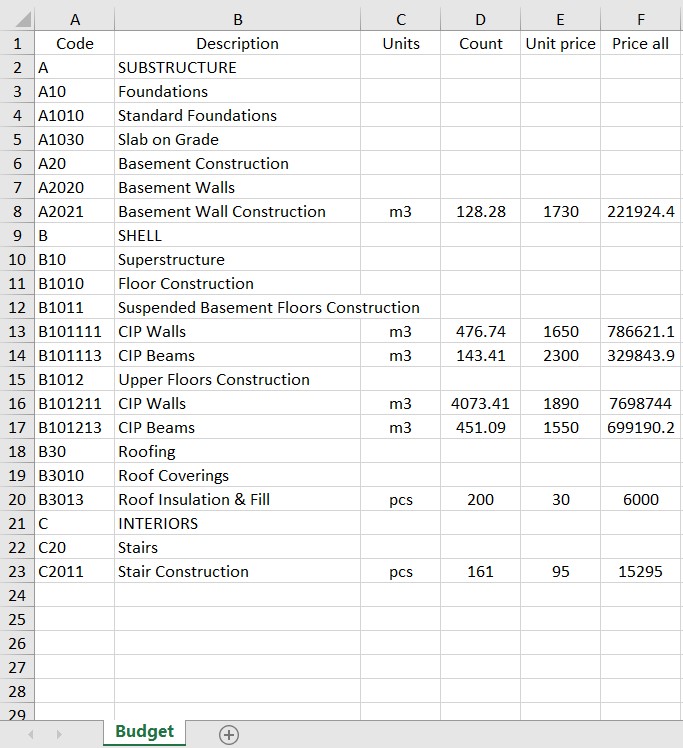
The tool allows you to export the cost of volumes per type of work to Excel.
To do this, make sure you have created search sets for the types of work in the "Sets" panel. You can do this using the "Works" command. In the types of work themselves, the "Unit cost" for each type of work should be filled in. (See Types of Work)
- Click on the SIGNAX PRO tab in the Export | Import panel ➤ Budget.
- An Excel file will be exported containing the total cost of volumes per type of work.
BIM-Link
BIM-Link import
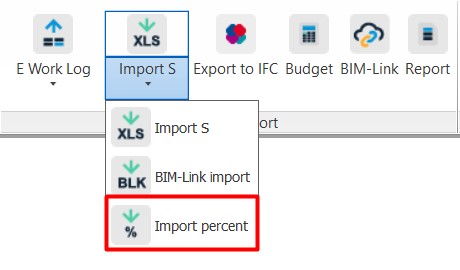
Percent import
The feature allows you to import the percentage of completed work into model elements from Excel. For example, you can use it to assess the progress of engineering networks with a breakdown by floors, apartments, or rooms. This provides more accurate control over the progress of work and helps to evaluate the project's completion status.
- Click on the SIGNAX PRO tab in the Export | Import panel ➤ Import Percent.
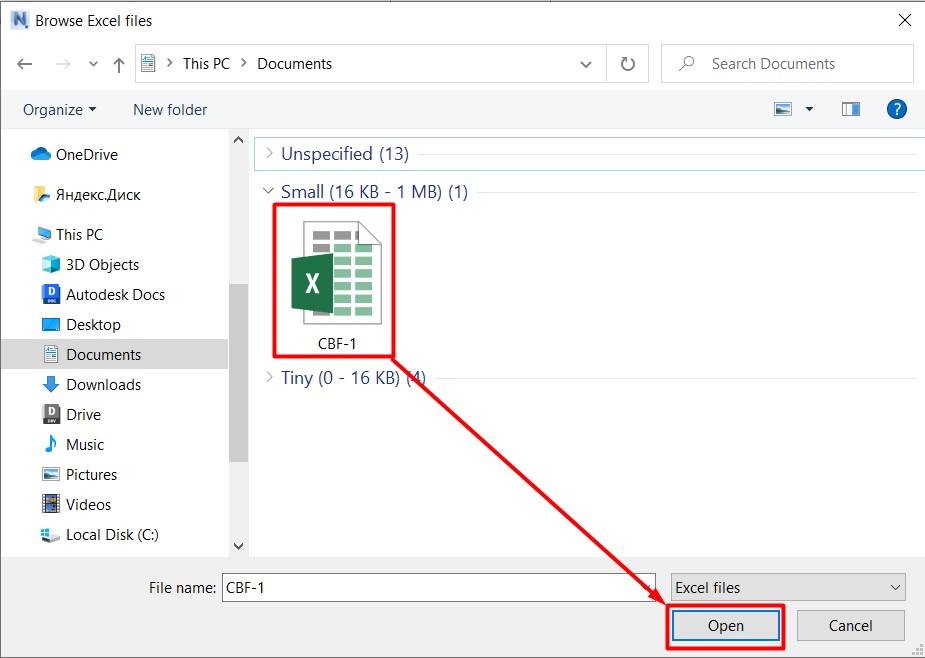
- In the opened window, select the Excel file and click "Open."
The structure of the Excel file looks as follows:
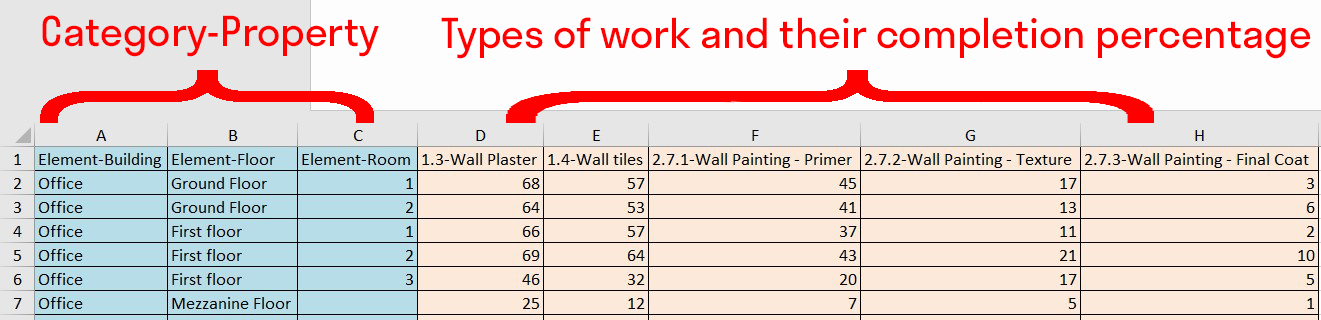
- The first three columns (A, B, C) correspond to properties and their values by which the plugin will find elements to which the percentage needs to be applied. Properties are written in the format "Category-Property." It is not mandatory to fill all three columns; any of them can be left empty.
- In the subsequent columns, specify the types of work and their completion percentage. The plugin will write these values into the corresponding elements. If a type of work does not have a CODE, only the name of the work is specified (e.g., Power Network). If the work has a CODE, it is written as follows: CODE "space" - "space" NAME. (For example, 4.1.1 - HVAC installation).
- After the import, the properties of the elements in the "SIGNAX" tab will show the corresponding property "W_{Type of Work}" and the percentage value of completed work.
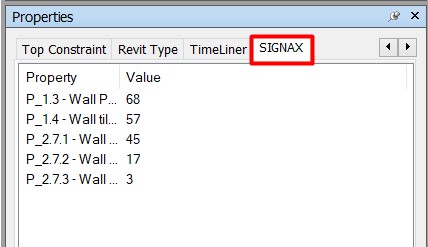
- To color elements according to the completion percentage, use the "Colorize" tool.

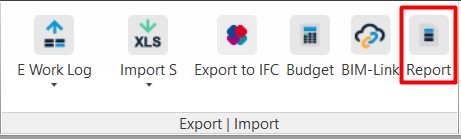
Report
The feature allows you to generate a report on completed types of work with an Excel table and a Graph.
- Click on the SIGNAX PRO tab in the Export | Import panel ➤ Report.
- The report configuration window will open. Add the report by clicking
 .
.
Fill in the necessary data and click "EXPORT TO PDF" and "EXPORT TO EXCEL."
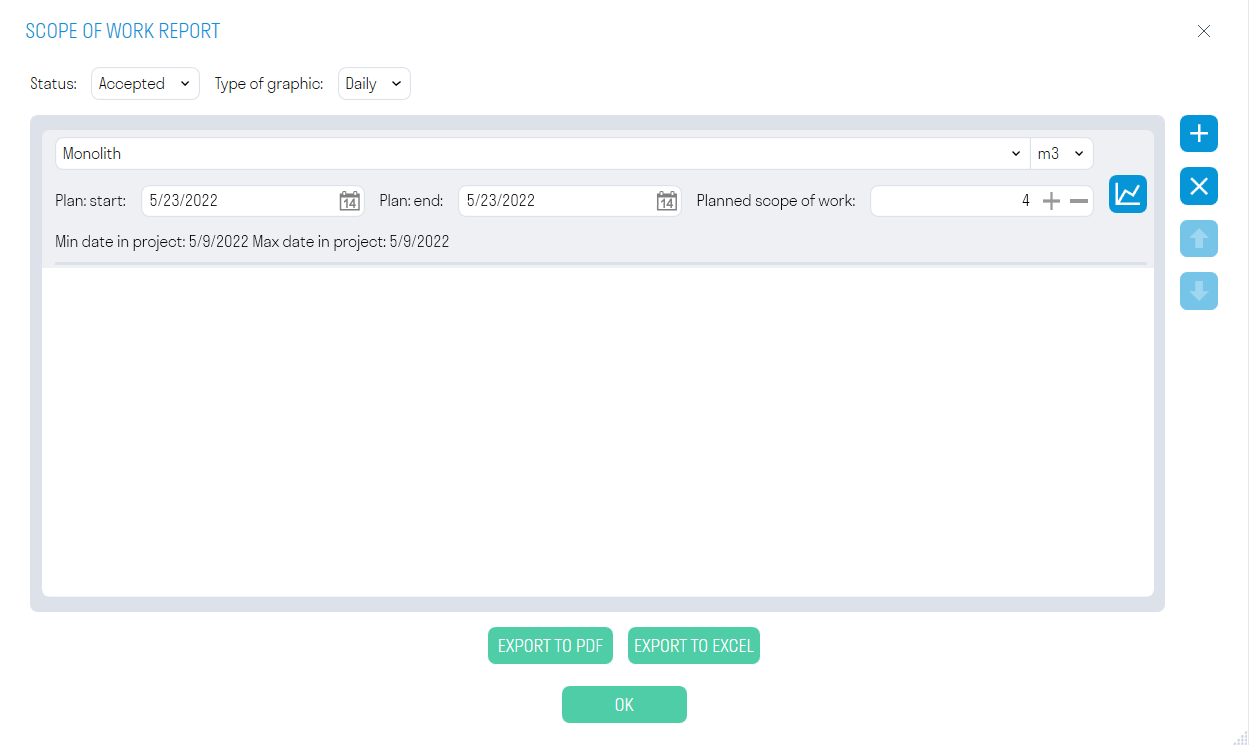
In the "Status" field, select the status of the elements for which you want to generate the report: "Completed" or "Finished." In the "Chart Type" field, select from the drop-down list.
Choose the type of work from the drop-down list for which you want to generate the report, and the units of measurement for the work. In the "Plan: Start" and "Plan: End" rows, specify the boundaries of the planned work, as well as the planned volume of work.
Click  to check the correctness of the generated chart.
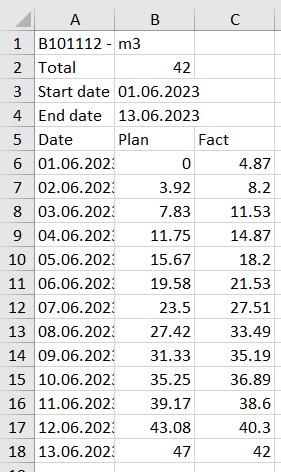
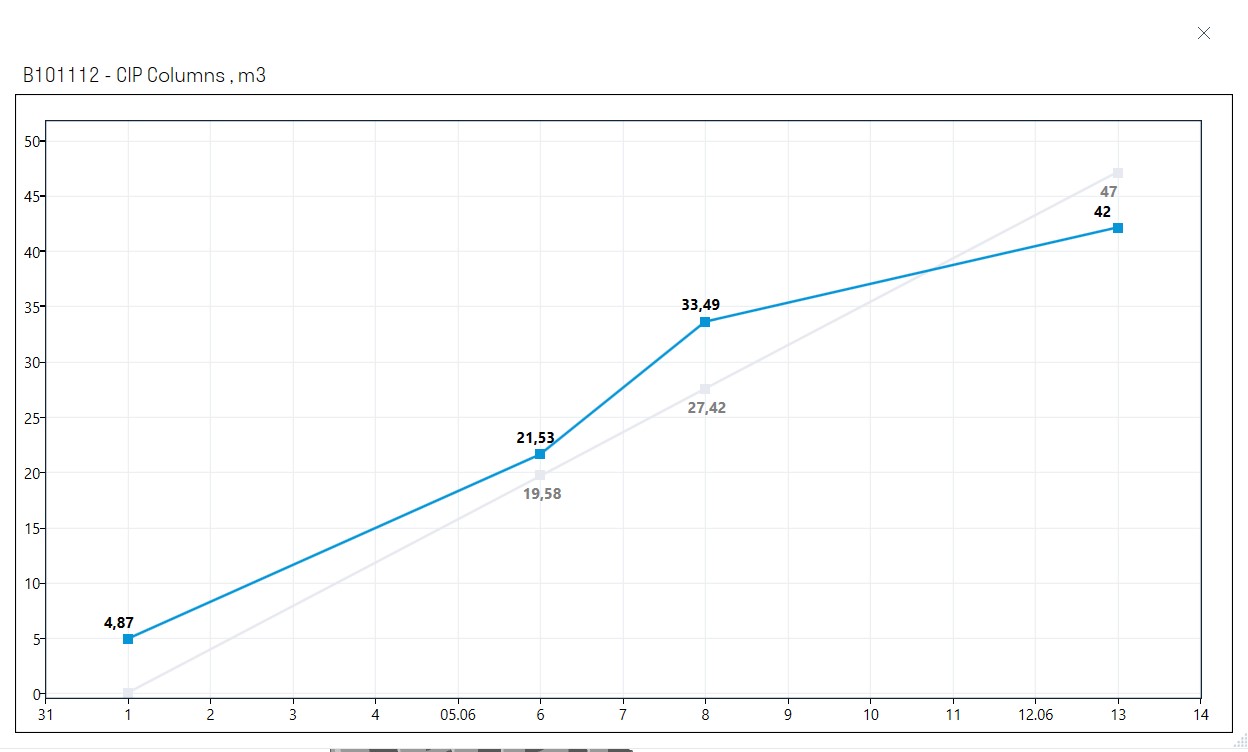
- An Excel table will be exported, and a graph with the planned and actual volume of work will be saved in PDF.
Work schedule
The comprehensive tool allows you to create a production schedule in the form of a Gantt chart using a convenient graphical interface and visualize the construction of the model based on the created schedule.
General workflow with the tool:
- First, on the "Work Schedule" tab, you need to create or import summary types of work from MS Project or Primavera in XML format. These types of work have been previously agreed upon in the contract and are necessary for tracking the start date of detailed work.
- Next, create or import detailed types of work that are linked to model elements using creation conditions (see more about creation conditions for types of work). These types of work will be used to construct the Network Graph.
- Open the "Calendar" and configure working and non-working days according to the project's production calendar.
- Go to the "Network Graph" tab and use nodes to create a network graph. Work packages serve as starting nodes and act as the starting point for detailed works. Drag nodes with works to the network graph area and connect them sequentially, specifying the duration of work. If necessary, you can add day shifts, for example, for concrete curing.
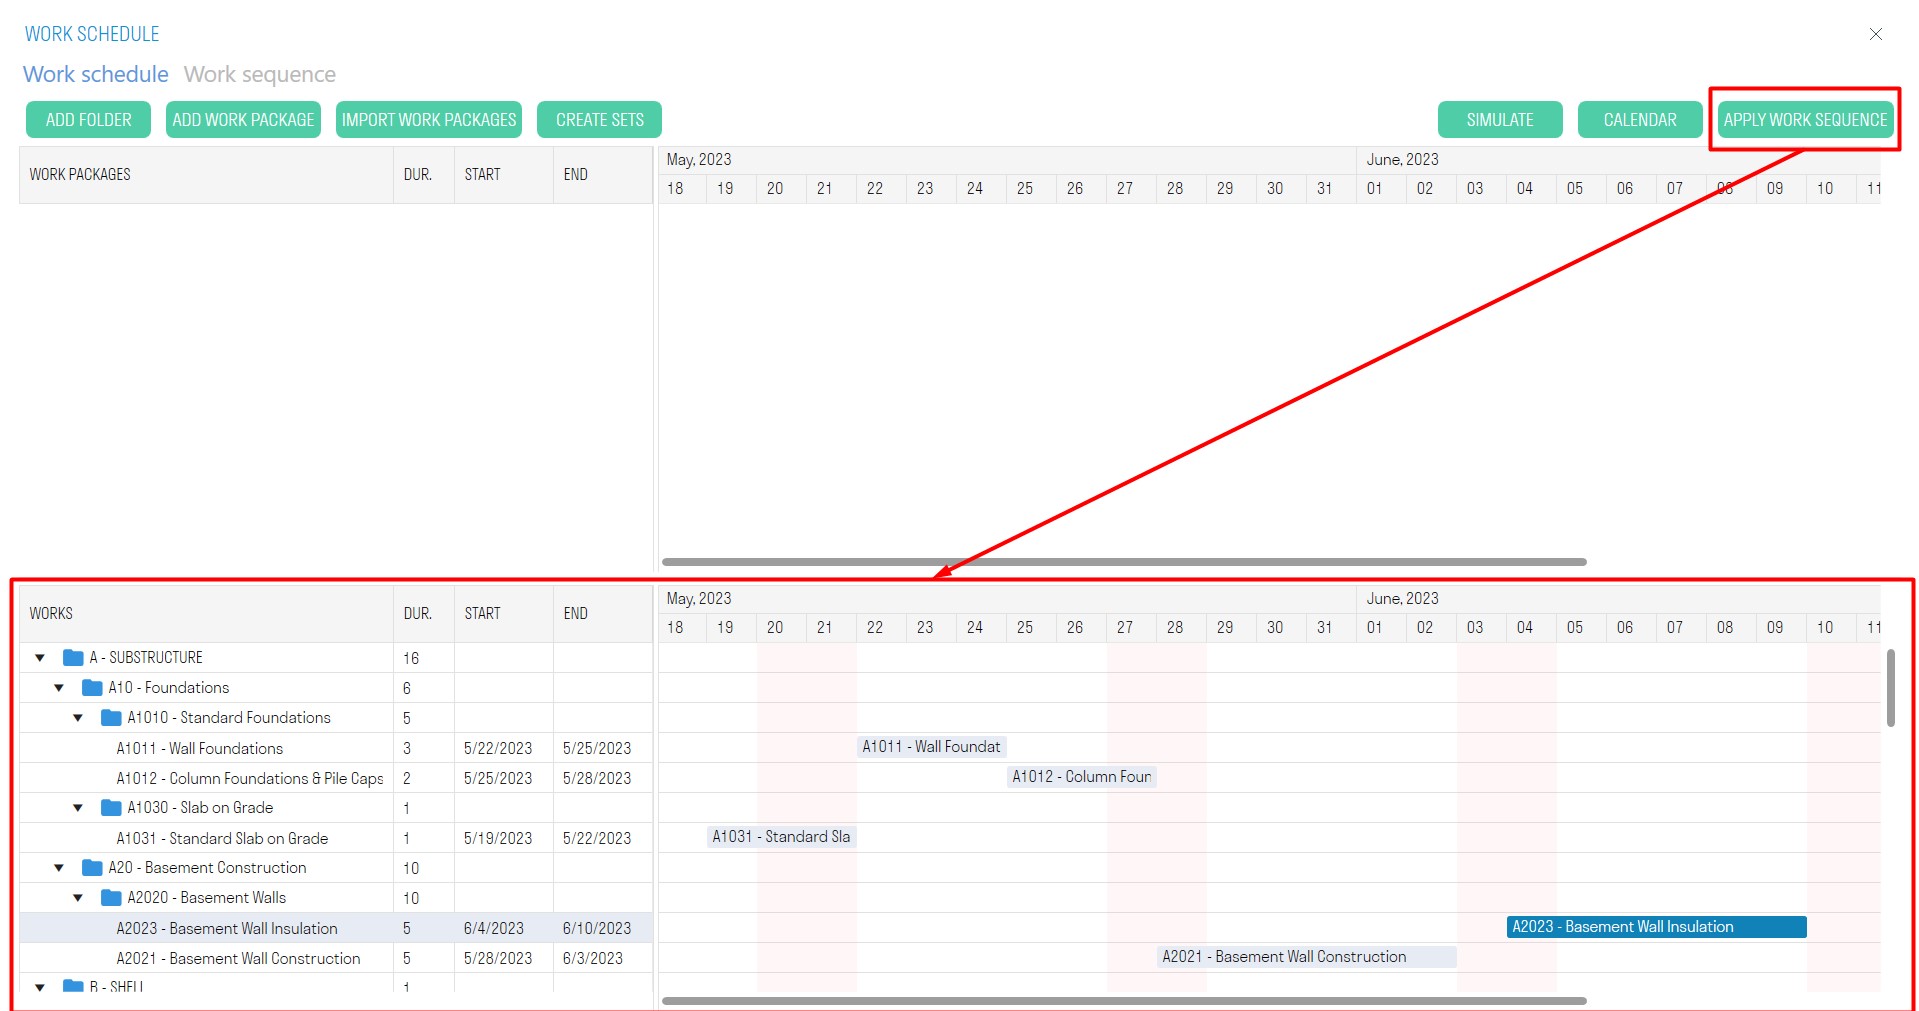
- Once the Network Graph is ready, return to the "Work Schedule" tab and click "Apply Network Graph." This will generate a Gantt chart for the detailed types of work at the bottom.
- This Gantt chart can be visualized in the model.
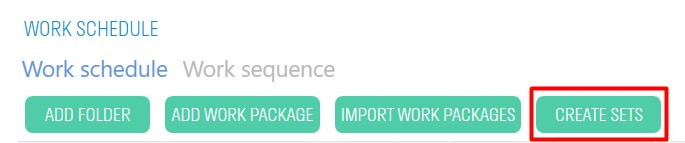
WORK SCHEDULE TAB:
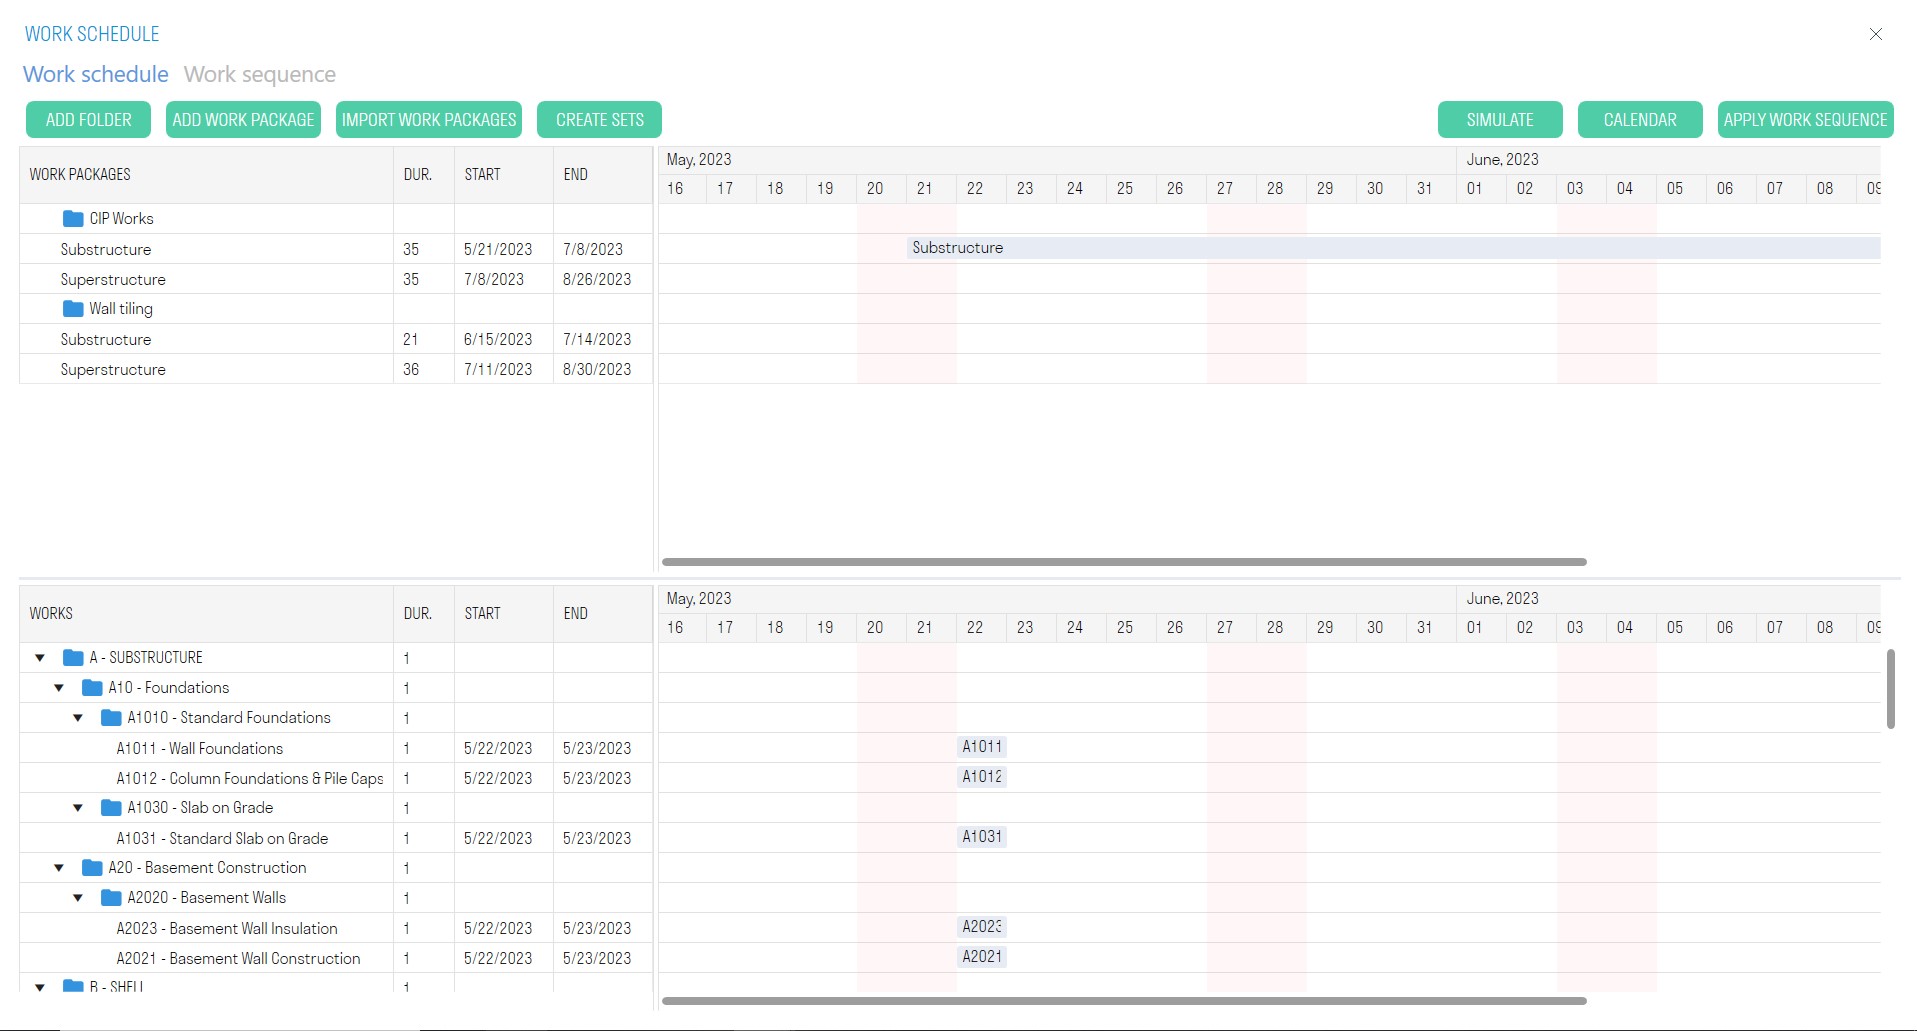
- At the top, there are work packages that have been agreed upon in the general contract, and the Gantt chart for work packages. These works are needed to link detailed works to them.
- At the bottom, there are detailed types of work linked to elements and the Gantt chart for these works. Based on these works, the network graph will be constructed, and then the Gantt chart will be generated.
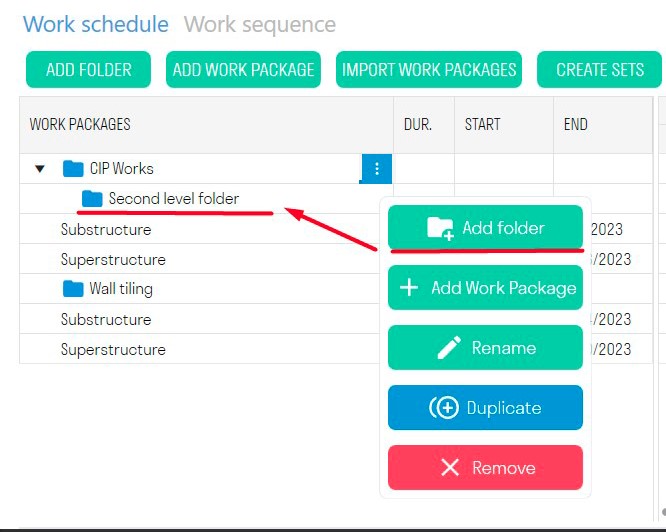
Creating Work packages:
Method 1 - Manual Creation
- Click "Add Folder" on the top panel to create a folder for work packages. The button located in the context menu creates a folder within the folder.
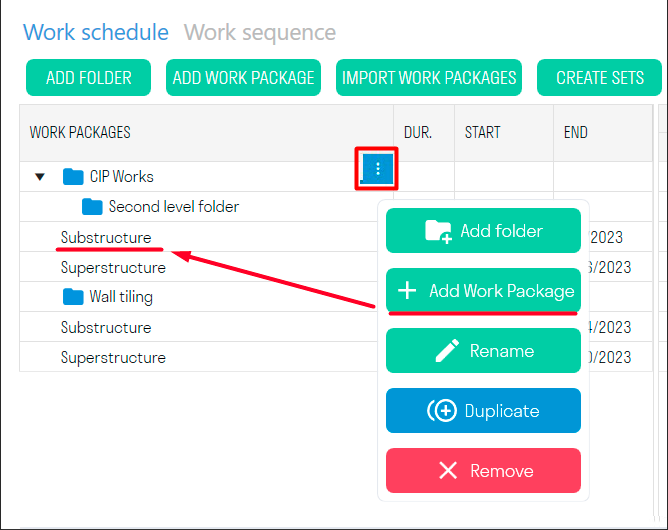
- Click "Add Work package" on the top panel to create a work package. The button located in the context menu creates a work packages within the folder.
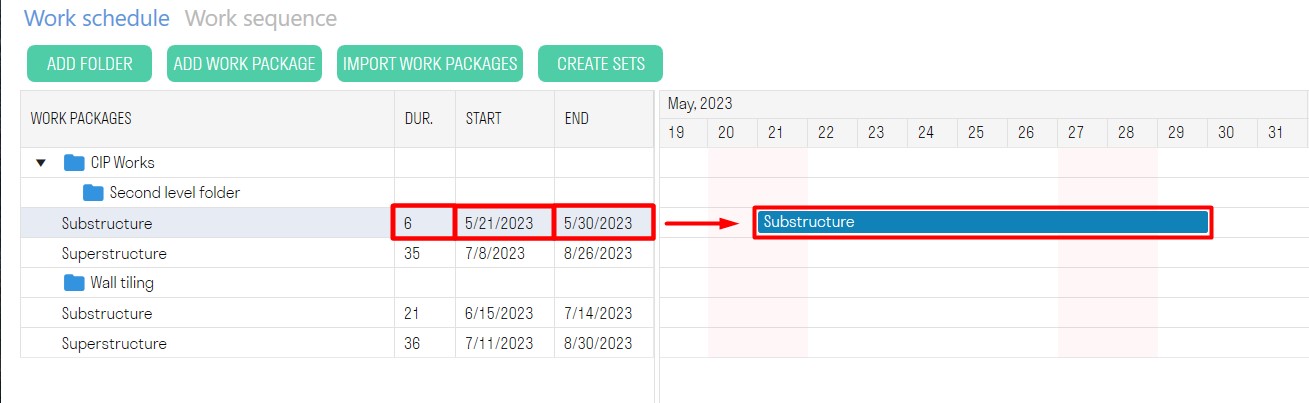
- Specify the Start, Finish, and Duration of the work ➤ the work packages will appear on the Gantt chart.
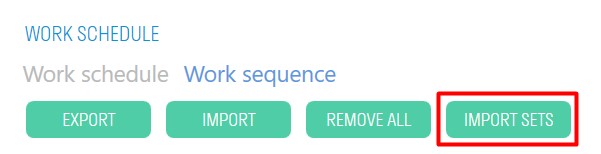
Method 2 - Import Work packages
"Import Work packages" allows you to import work packages with linked dates from MS Project or Primavera in XML format.
Creating Detailed Works:
Detailed works are created in the types of work (see Types of Work). Based on these works, the network graph will be constructed, and then the Gantt chart will be generated. To visualize the model's construction and view the work volume, you need to specify creation conditions for these types of work (see Creation Conditions for Types of Work).
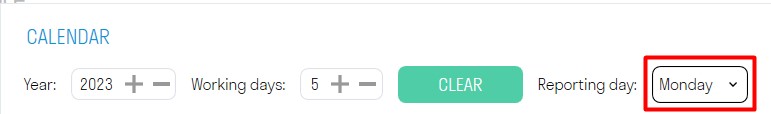
Calendar:
Thanks to the flexible calendar settings, you can set working and non-working days according to your production schedule. The duration of work depends on the working schedule, meaning that the duration considers only working days.
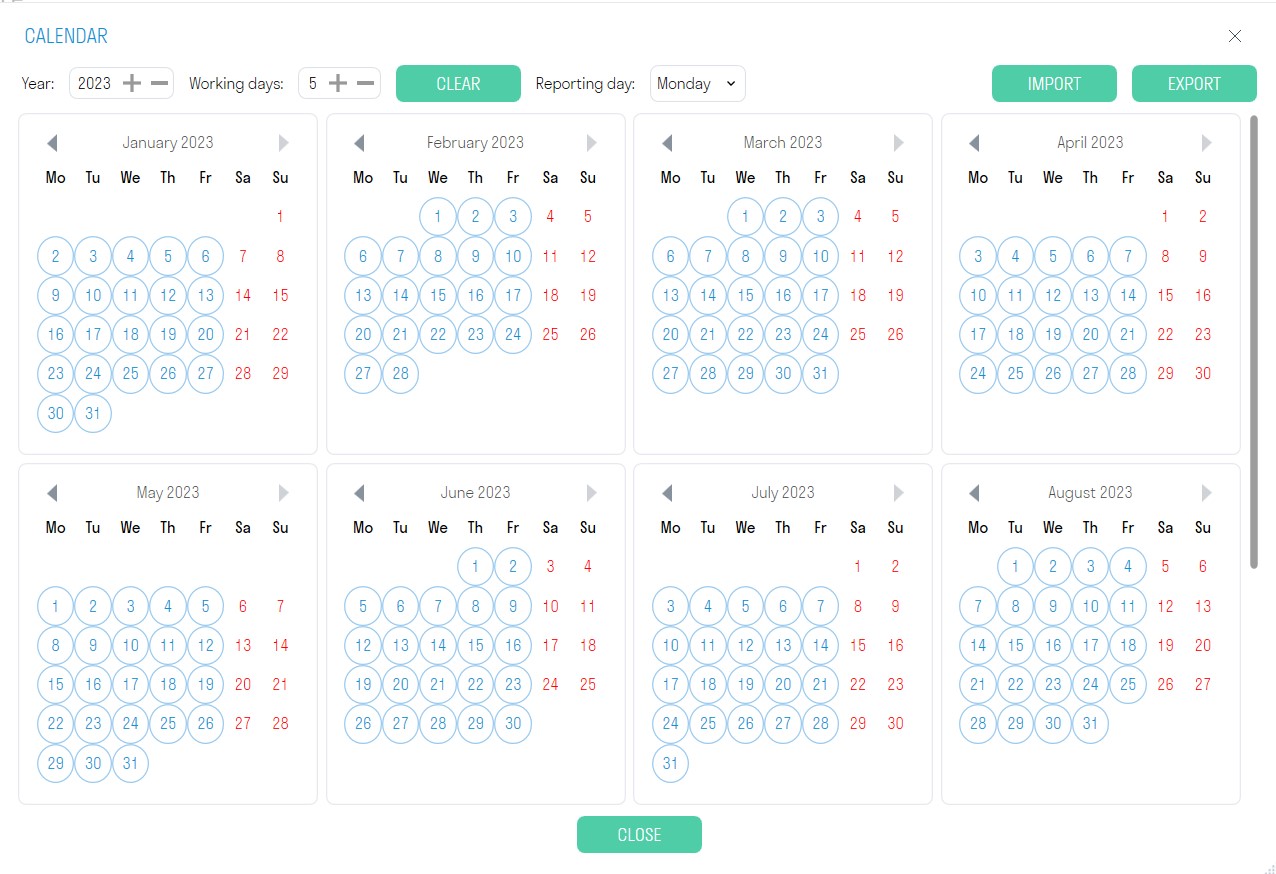
- In the "Working Days" field, specify the number of working days per week for the project and click "Clear."
- For more flexible settings, click on a date in the calendar to make it a working or non-working day.
Simulate
Simulate is a tool used to create timelines that display the sequence of construction activities. It allows users to visualize and analyze changes that occur in the project over a specific period of time.
Beforehand, it is necessary to create search sets for types of work using the "Work" command.
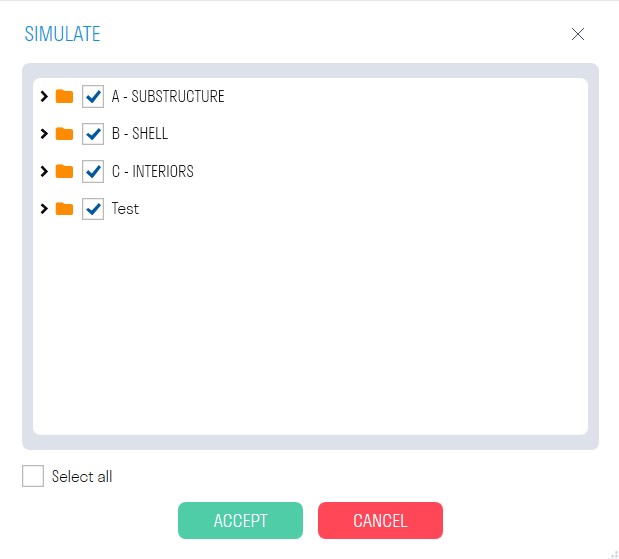
- Click "Simulate" and in the opened window, check the works you want to visualize. Then click "Accept."
- The visualization window will open. Select the start date for visualization and the step option (Day; Week; Month; End Date - switching to the next step is based on the works' end dates).
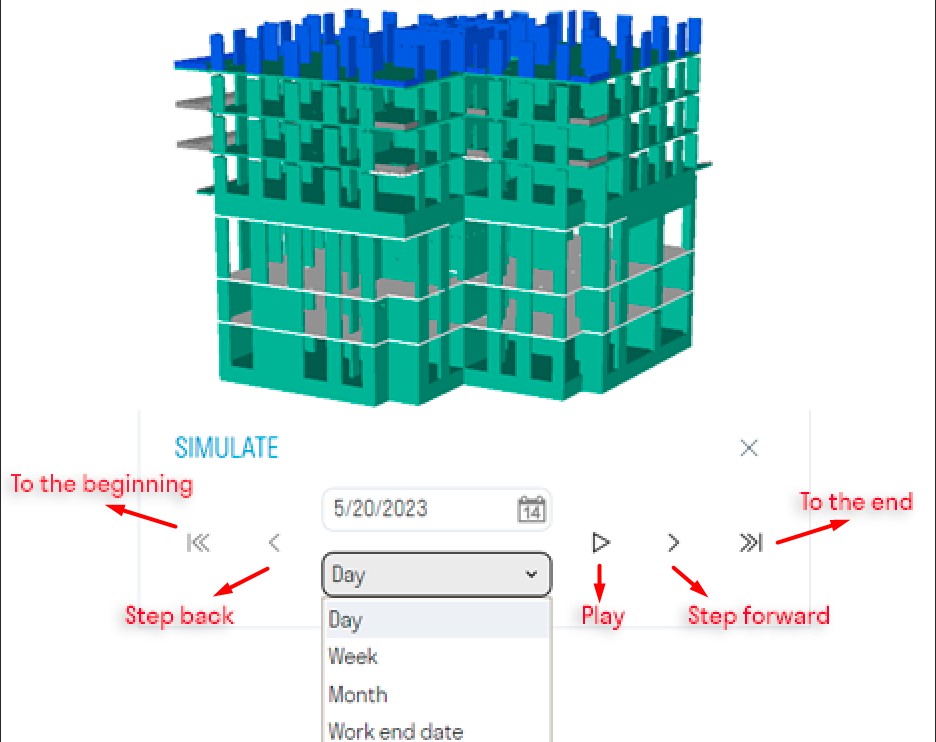
- Select the start date for visualization.
- Choose the step option: Day; Week; Month; End Date - switching to the next step is based on the works' end dates. The reporting period in the Calendar determines which days will be displayed when visualizing with the Week step option.
- Start the simulation.
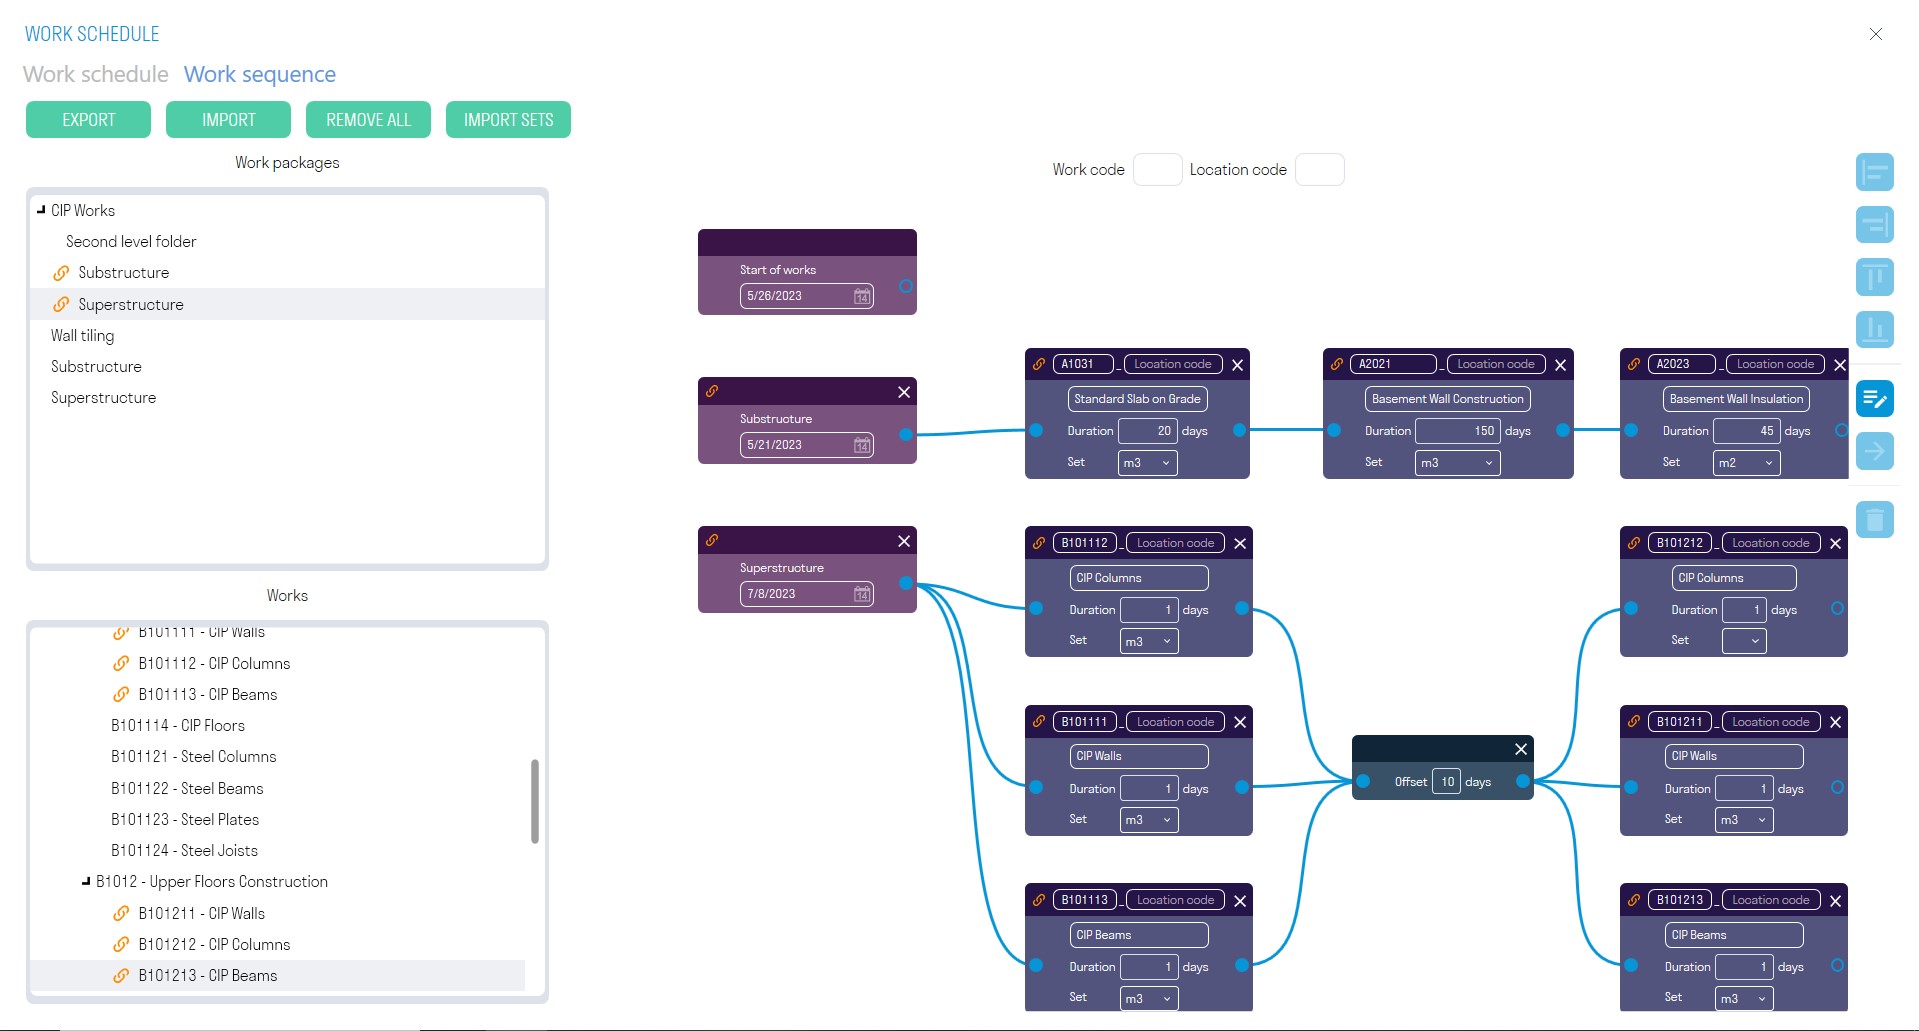
NETWORK GRAPH TAB:
The network graph allows planning the construction timeline and the sequence of building components using nodes linked to work packages. The nodes display a clear sequence of works with their durations, which simplifies creating the Gantt chart.
Nodes are objects that contain types of work and are interconnected to form the construction sequence.
Creating Nodes:
The network graph window is divided into three parts: Work packages at the top left, Detailed Works at the bottom left, and the workspace with nodes on the right.
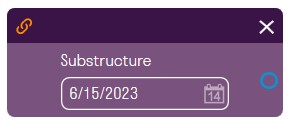
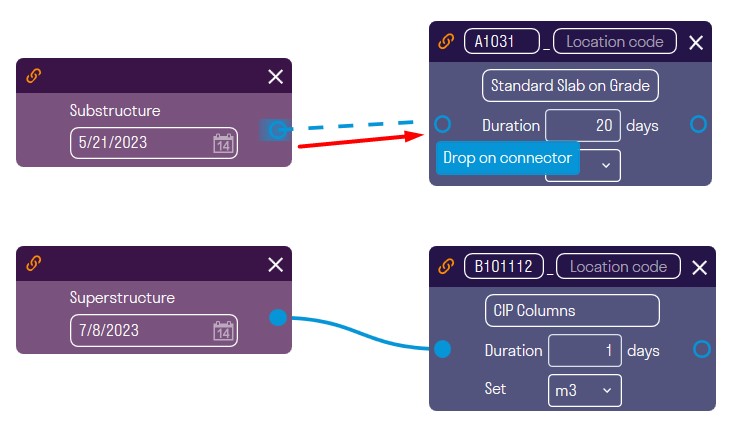
- Drag a work package into the workspace.
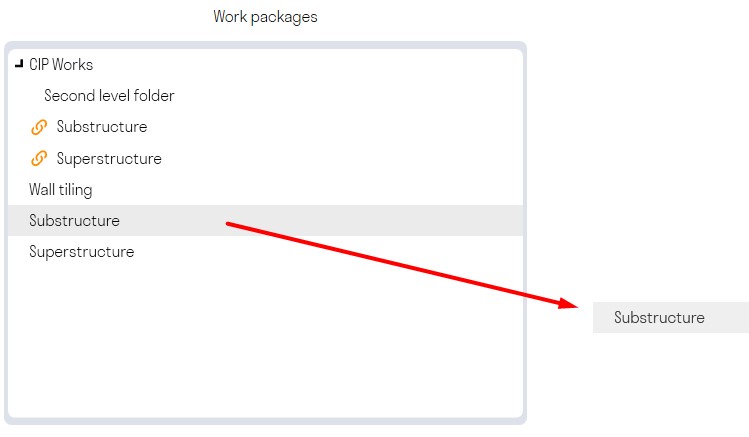
A node with the work package will be created. This node shows and sets the start date of the work, for example, the start of a Substructure assembly. This start date is taken from the work package you previously imported on the Work Schedule tab.
If you need to build a work schedule for one type of work, for example, only Monolith or only Tiling, then you can use the “Start of works” node. This node is not tied to enlarged jobs and is always located in the work area. Indicate the start date of work.

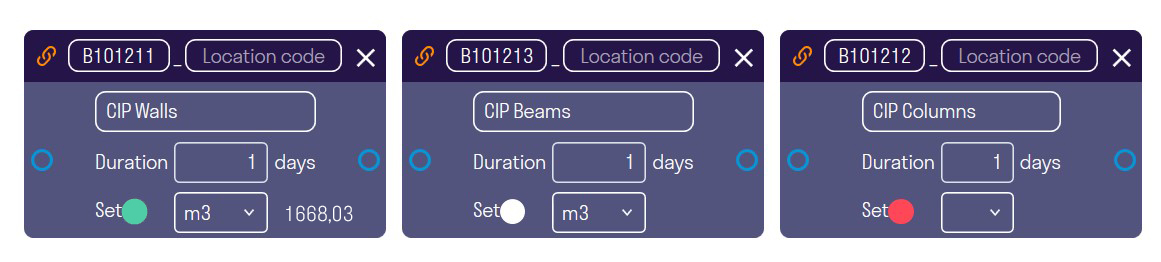
- Drag a detailed work into the workspace.
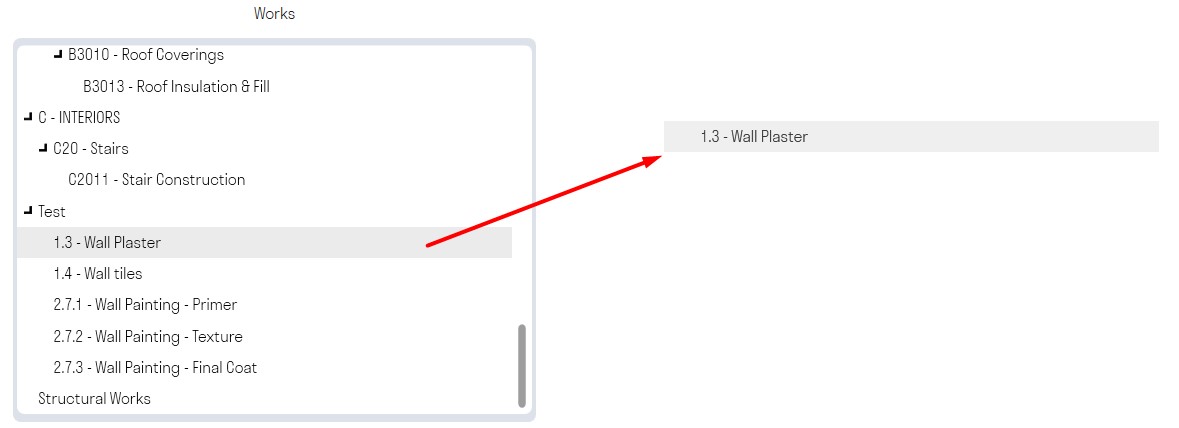
A node with the detailed work will be created. This node takes the start date of the work as input, adds the work duration, and outputs the work's end date.

- Fill in the "Work Code," for example, 4.1.1.
- Specify the "Location Code," for example, L01.
- Provide the work duration and units of measurement.
- The Set is used to track the work volume based on creation conditions (see Volume of Works).
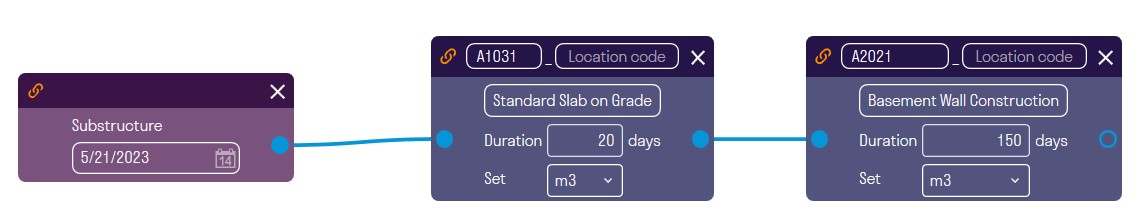
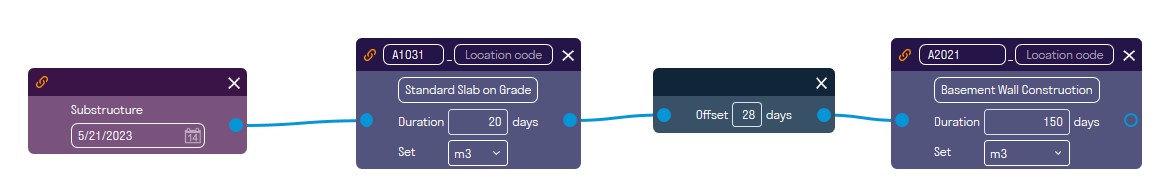
- Connect the node with the work package to the node with the detailed work. To do this, hover over the output of the work package, press and hold the left mouse button, and drag the link to the input of the detailed work. Thus, the node with the detailed work will receive the start date of the work.
Then connect the detailed work to the next detailed work, and so on. In this example, the installation of the walls on the basement floor will start after the completion of the slab on grade with a duration of 20 days.
- If necessary, set an offset for the start of the next work, for example, for the next work to start after concrete strength gain.
Right-click in the workspace ➤ Add Offset node
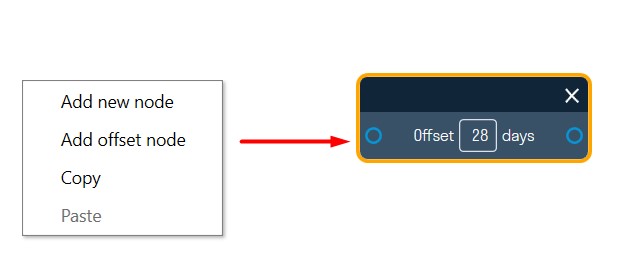
The offset takes the end date of the work as input, adds the offset in calendar days, and outputs the start date of the next work.
Set the offset and connect it to the works.
- You can also create a custom node that is not linked to types of work in the SIGNAX panel and is not considered in volume calculations but is necessary for work planning.
Right-click in the workspace ➤ Add New Node.
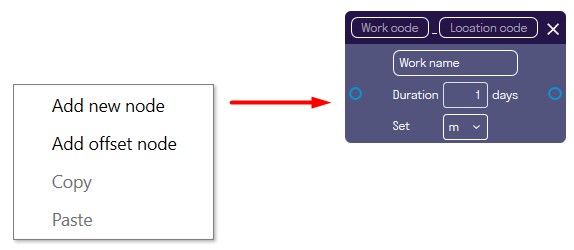
This node does not show volumes since the work is not specified in the SIGNAX panel and it is impossible to set creation conditions for it.
- Multiple works can be connected to one node's output, for example, to define parallel facade installation of the building.
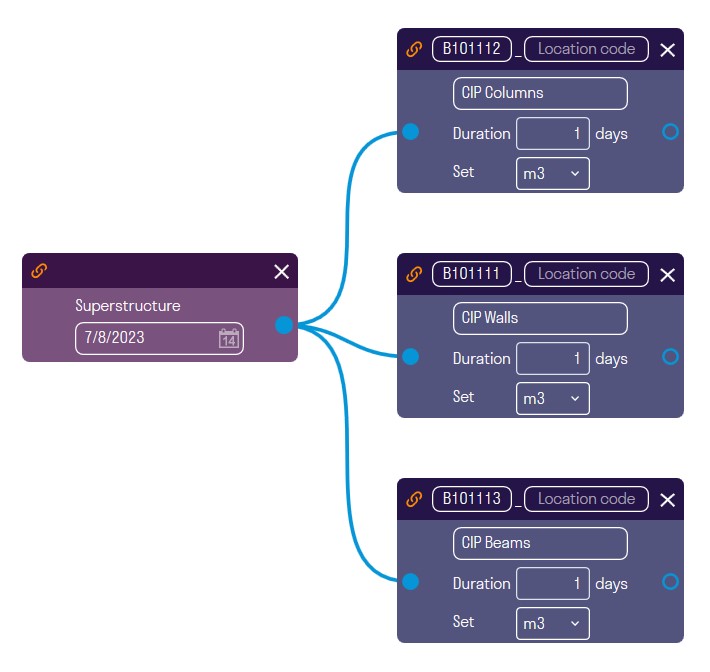
Several works can be connected to one node's input. The work will then start on the latest end date of the attached works.
-
Continue connecting works one after another as they should be executed on the construction site, specifying work durations, and applying time offsets if necessary.
-
After completing the network graph, switch to the "Work Schedule" tab and click "Apply Network Graph." This way, a Gantt chart for the detailed works will be generated based on the data from the network graph.
Work scope
To determine the work scope, you need to fill in the creation conditions for types of work in the SIGNAX panel (see Creation Conditions).
- On the Network Graph tab, click "IMPORT WBS."
- Work volumes and corresponding statuses will appear on the nodes:
 "Work Found in Current Project": This type of work is present in the types of work in the SIGNAX panel, and its creation conditions are correctly filled.
 "Work Found in Current Project, but Volume is 0": This type of work is present in the types of work in the SIGNAX panel, but its creation conditions are incorrectly filled or missing entirely.
 "Work Not Found in Current Project": This type of work is absent in the types of work in the SIGNAX panel and is created exclusively in the work schedule.
Bulk Editing of Nodes
Bulk editing of nodes allows you to set units of measurement and duration for multiple nodes simultaneously.
Click  on the right side of the network graph workspace.
Bulk Editing Nodes Window
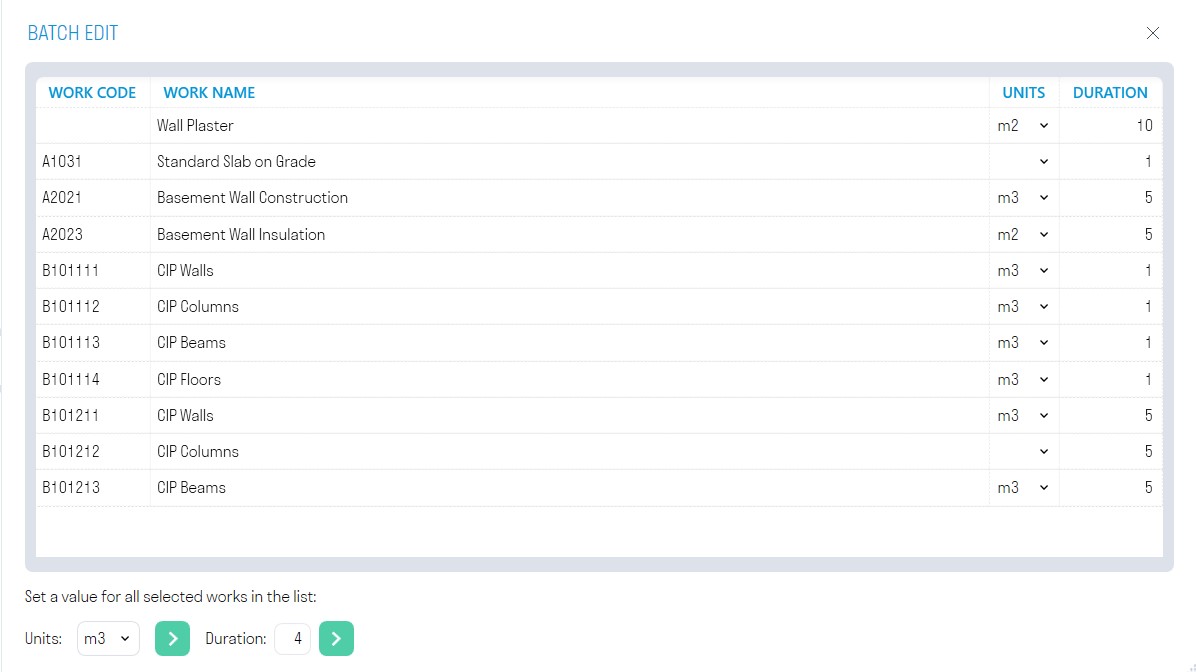
In the list, select the nodes you want to edit. At the bottom in the "Units of Measurement" row, choose the units of measurement to assign to the selected nodes and click  .
.
In the "Duration" row at the bottom, specify the duration to assign to the selected nodes and click .
Import and Export of Nodes
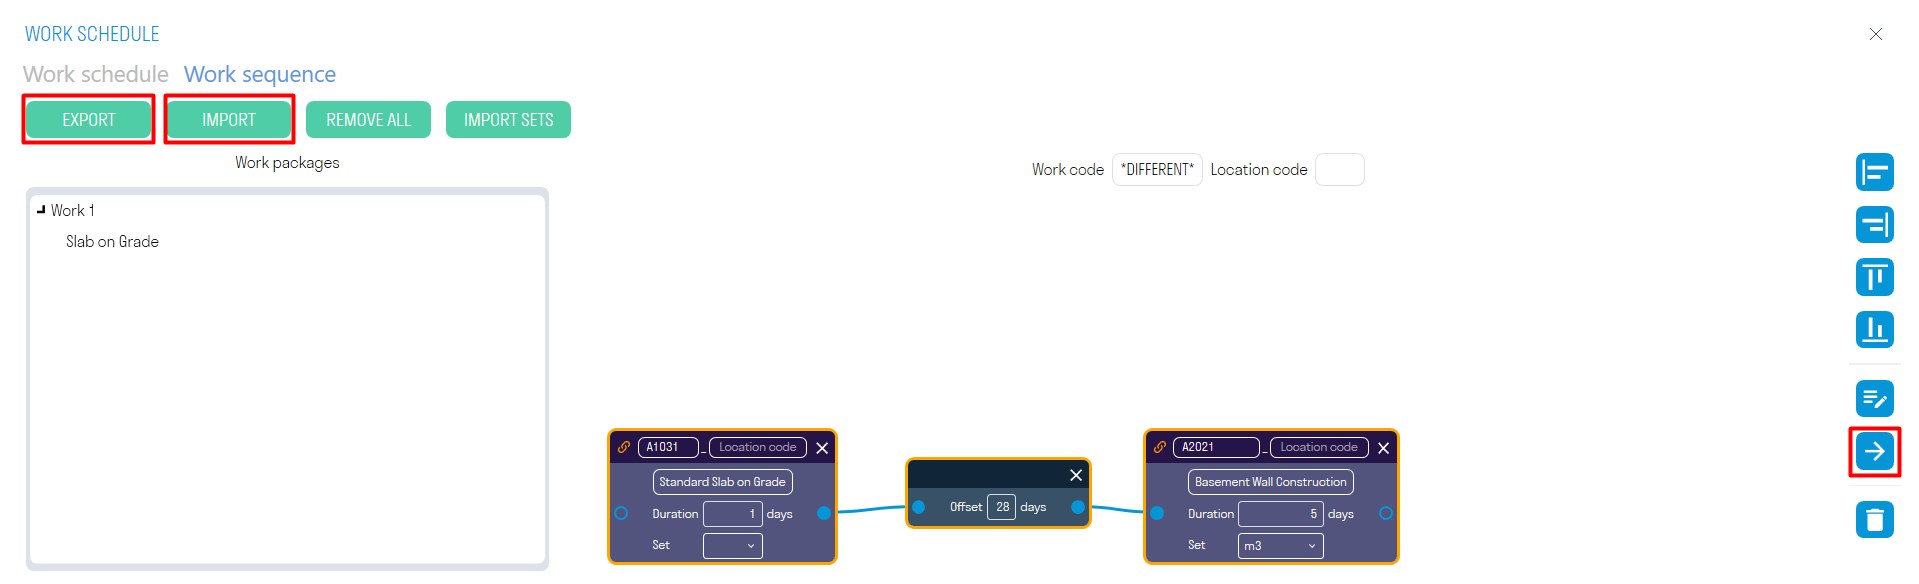
-
To export nodes in XML format, click "EXPORT." You can send this data to your colleagues.
-
To import nodes, click "IMPORT."
-
To export specific nodes, select the nodes and click
 on the right side of the workspace.
Node Alignment
Use alignment tools to align nodes vertically or horizontally.
Select the nodes and click one of the buttons on the right side of the workspace:
 Align Nodes to the Left Edge
 Align Nodes to the Right Edge
 Align Nodes to the Top Edge
 Align Nodes to the Bottom Edge
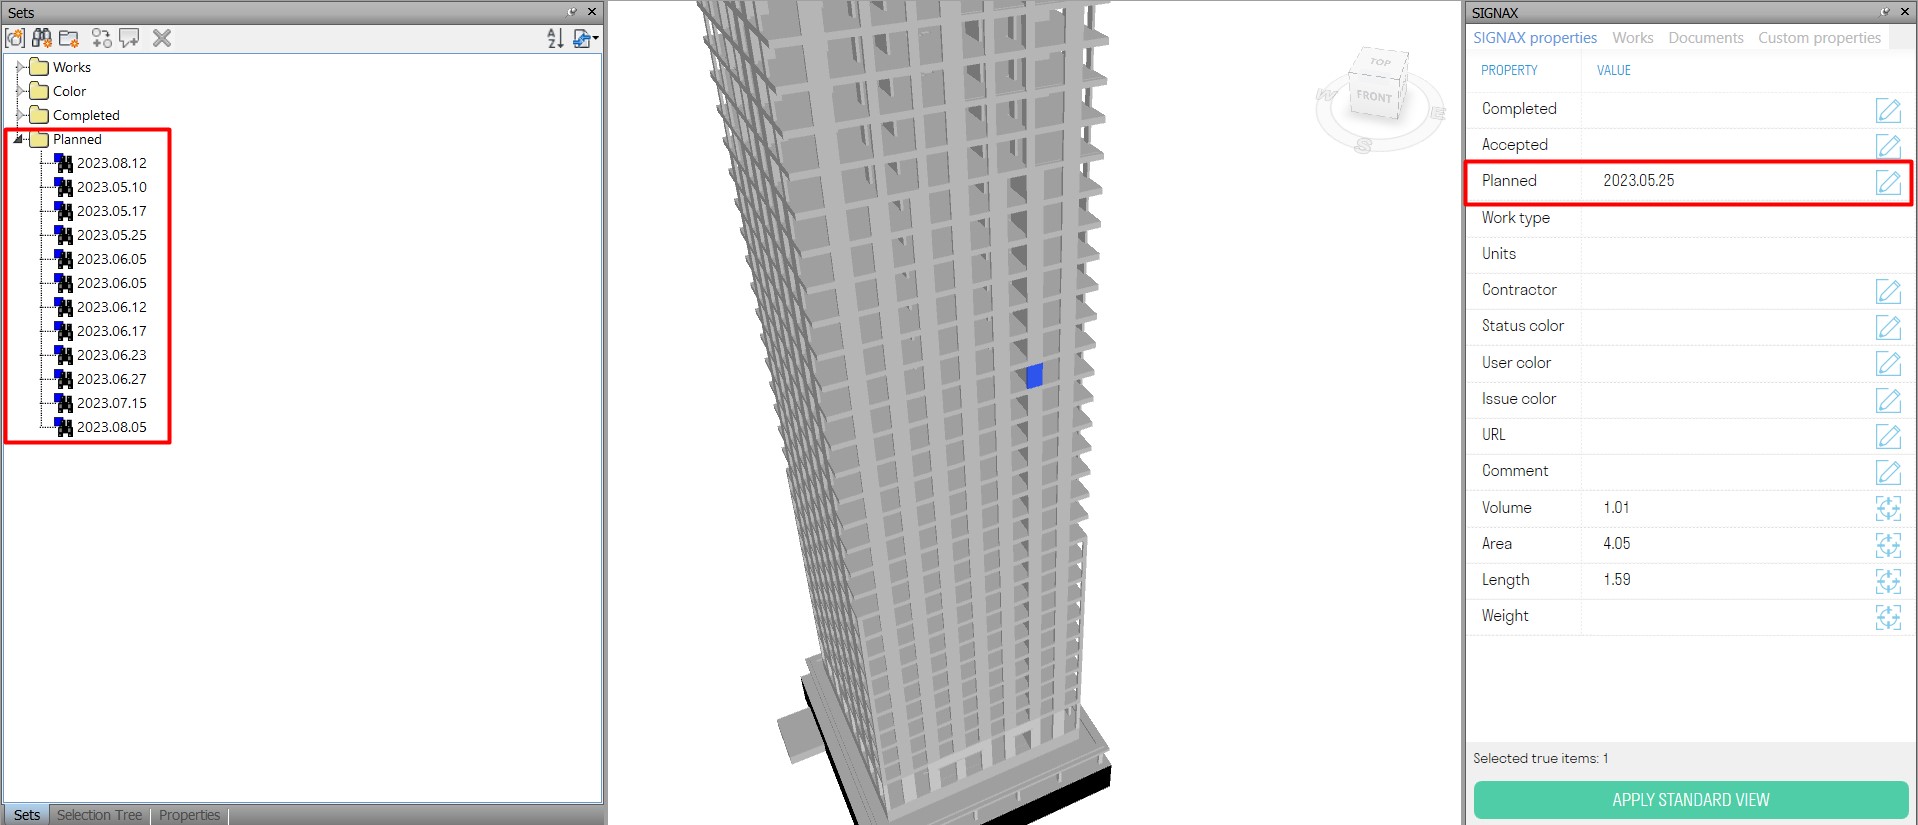
Creating Planned Search Sets
This tool creates search sets of Planned nodes based on the planned completion dates of the works, allowing you to load this model into the "Plan-Fact" cards of the DASHBOARD module as a model with planned works.
Beforehand, you need to create search sets for types of work using the "Work" command.
- Click "Create Sets."
- A property "Planned" will be created in the elements on the SIGNAX tab. Based on this property, corresponding search sets with planned dates will be created in the "Sets" panel. This model can be used as a planned model for the "Plan-Fact" cards of the DASHBOARD module.
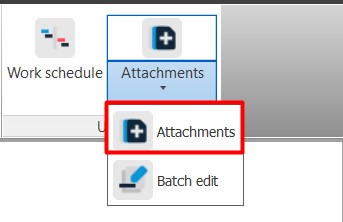
Attachments
The feature allows you to attach documents to elements based on the registry in Excel.
- Click on the SIGNAX PRO tab in the Utilities panel ➤ Attachments.
- The file explorer window will open to select the Excel file with the registry. Choose the Excel file and click "Open."
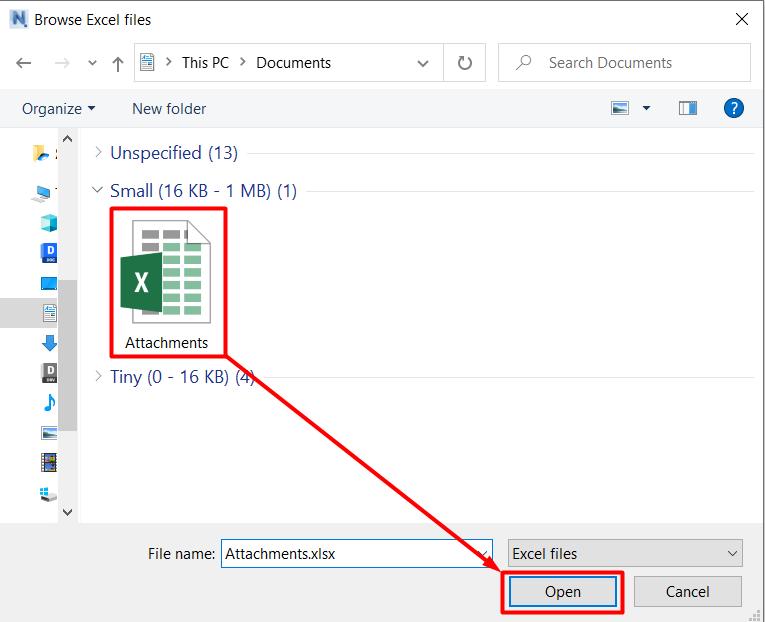
The structure of the Excel file is as follows:

- In column A, specify the position of the document in the table, for example, 1, 2, 3, etc.
- In column B, provide the path to the file or folder. You can specify either the full path or the path relative to the root folder specified in the Document Settings.
- Starting from column C in row 1, list the properties in the format "Category-Property," which the plugin will use to identify the elements to which the documents need to be attached.
- In the intersections of paths and properties, fill in the cells with the values of the listed properties from the previous step. Multiple filled properties for one path are specified using the "AND" operator.
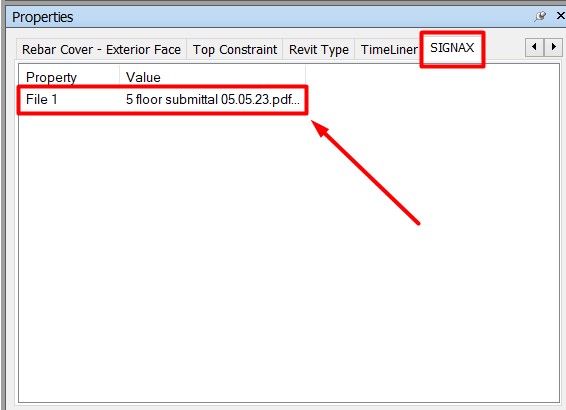
- The documents listed in the registry will be attached to the elements. You can see the attached documents in the SIGNAX panel under the Documents tab or in the properties of the element under the SIGNAX tab.
No Comments