< DASHBOARD. Cards 40. Volumes | DASHBOARD. Cards 60. DOCS >
What's New
Major changes are listed here. Click on the version number for details.
Notations
 — new features
 — functionality improvements
 — bug fixes
** 2025.29 ** 03.10.2025
Fixed display of previews of large models in 50 cards.
** 2025.28 ** 25.09.2025
Fixed the error of incorrectly recording the Plan and Fact in the settings of the 50th card upon first opening.
Corrected the alphabetical sorting of types of work in the 50th cards.
** 2025.27 ** 18.09.2025
Fixed the incorrect display of the background in the 52nd card.
Information about earlier updates is available in the closed Telegam channel for SIGNAX users. To add ** Contact support **.
¶ 50_3D volumes in BIM by date
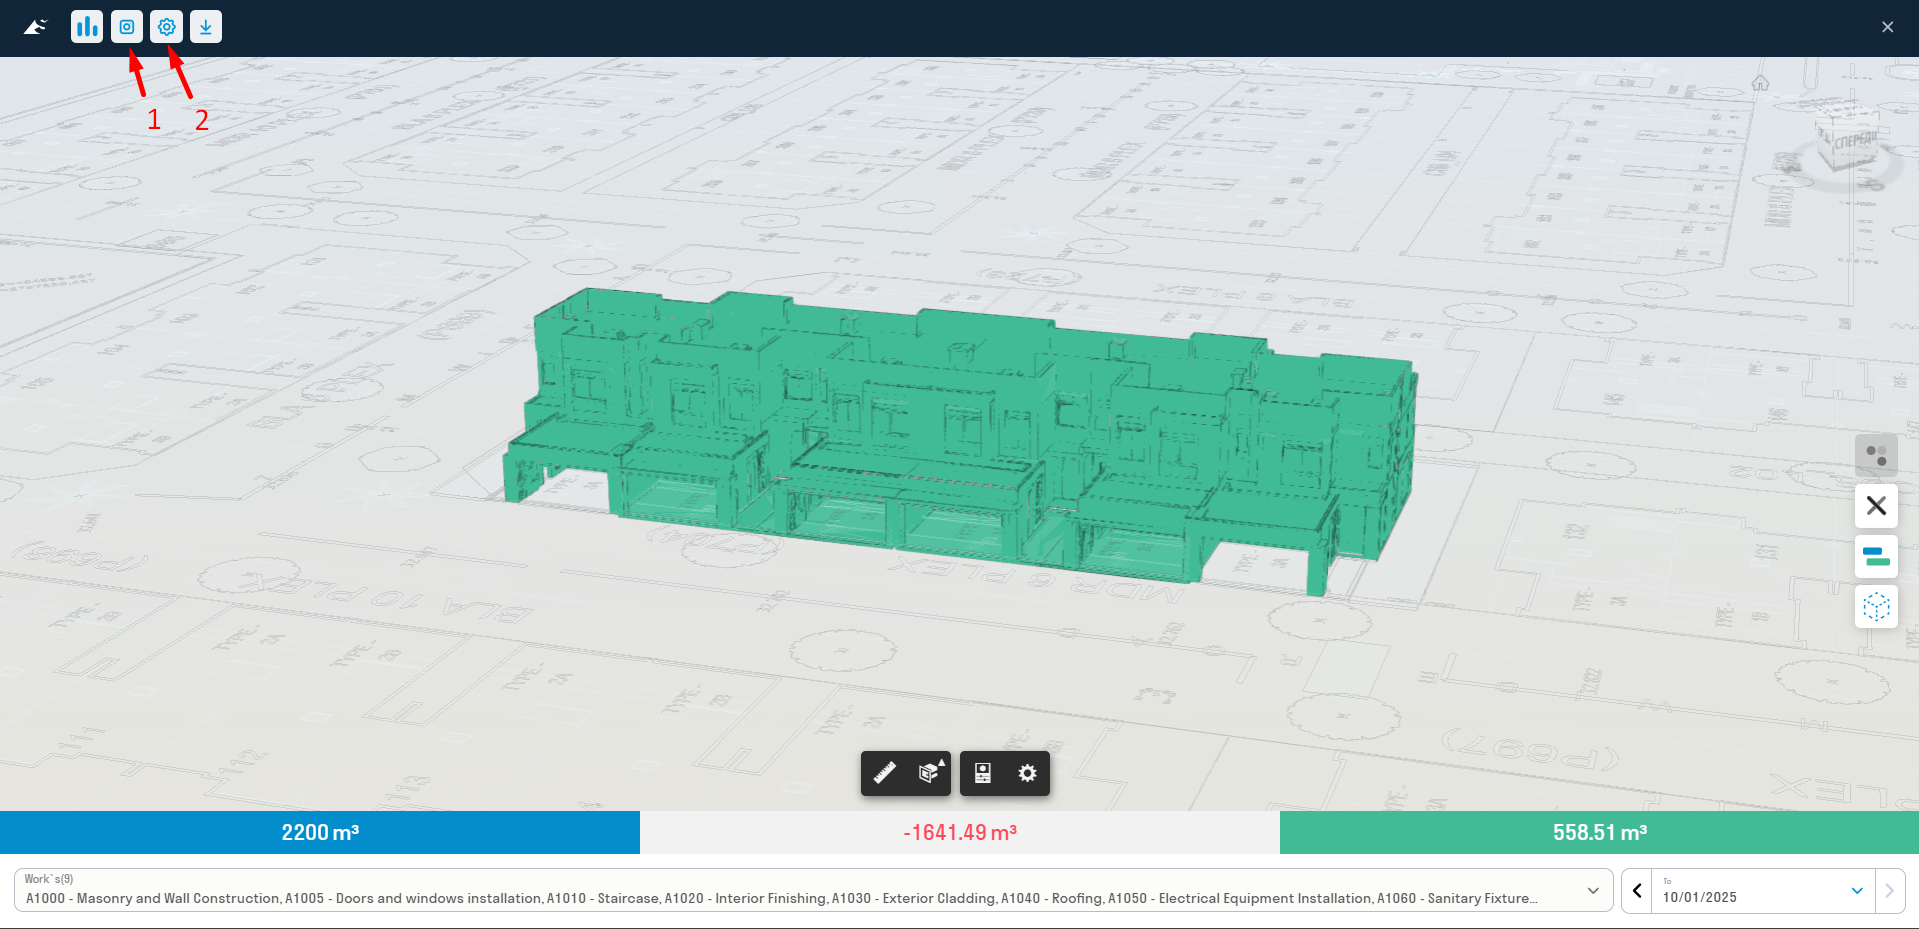
allows you to view the 3D construction model, as well as calculate the planned/actual volume of lead/lag in the volume of work completed on a specific date.
Displaying a card in user mode
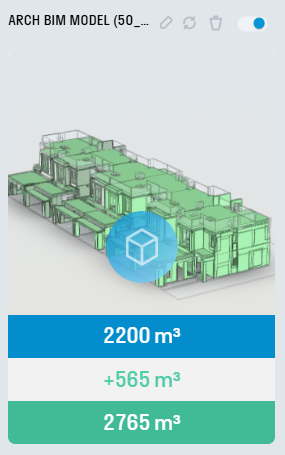
When opening a card:
1-display of the schedule by volumes of completed and planned work
2-planned volume of work on the date specified in 6
3-lag/lead of actual and planned volumes
4-actual volume on date 6
5-list of types of work
6-reporting date
7-tools for working with models
8-show/hide the background (if loaded)
9-display the Navisworks model
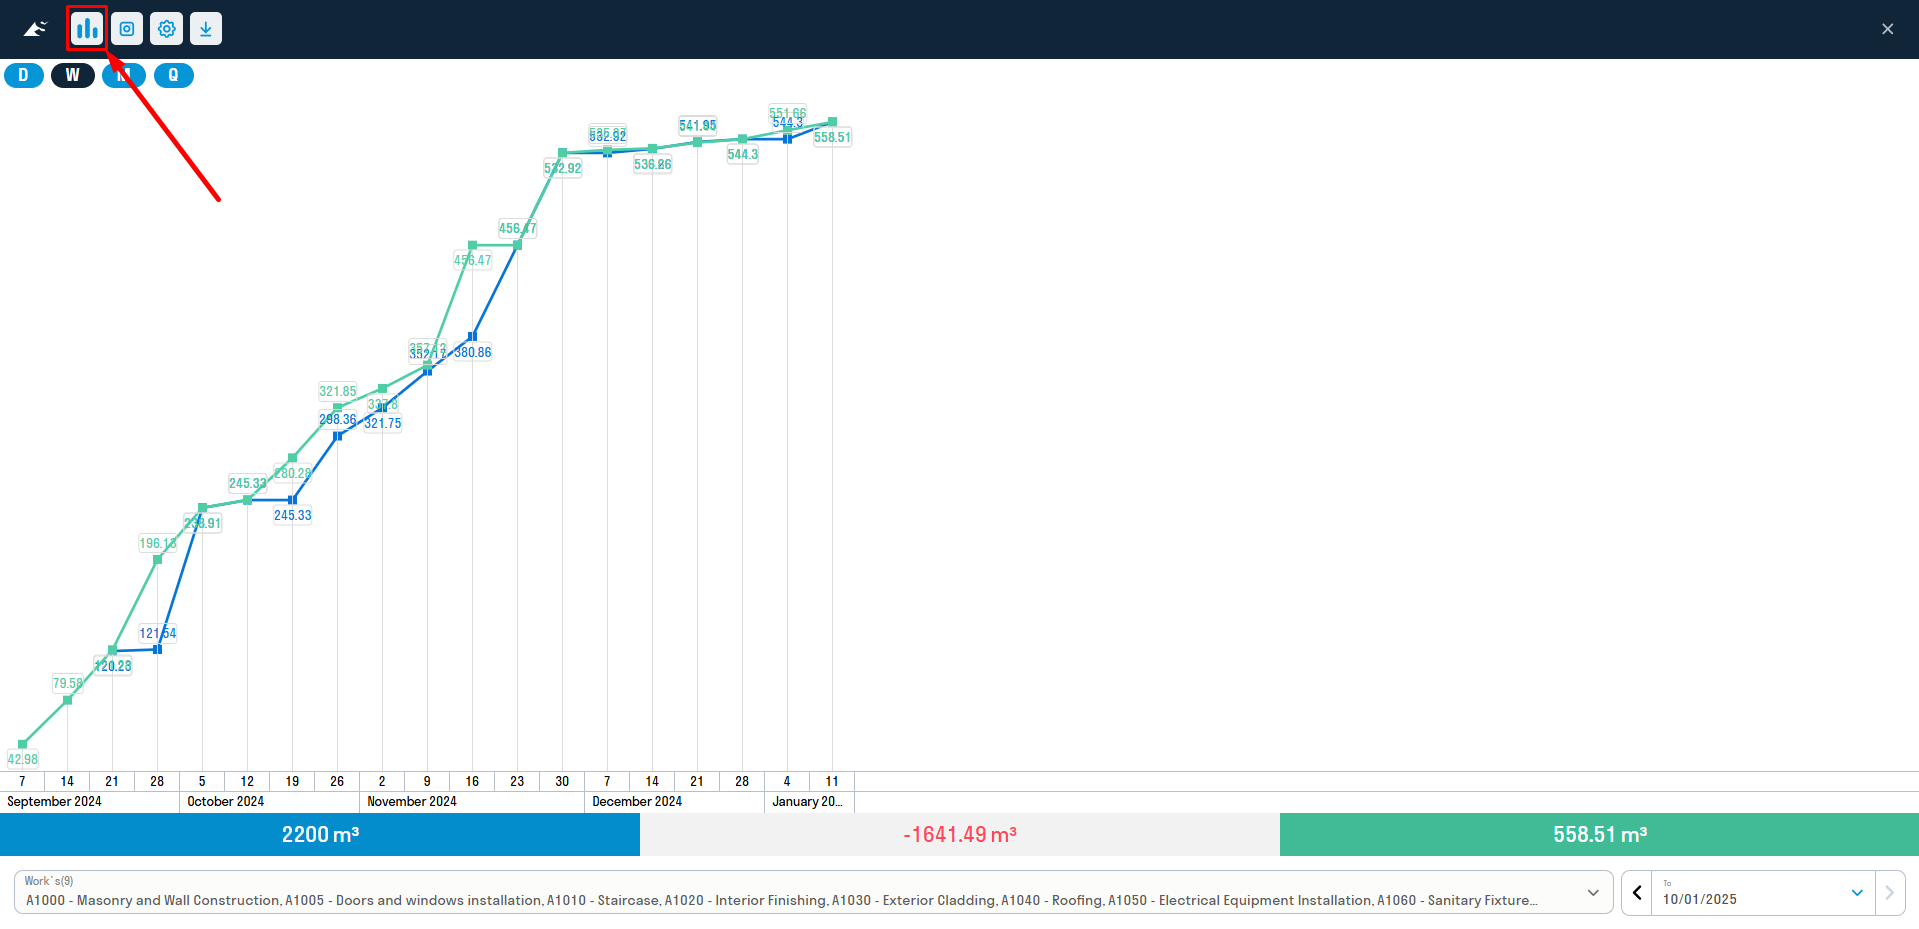
¶ Plan-fact chart (figure 1)
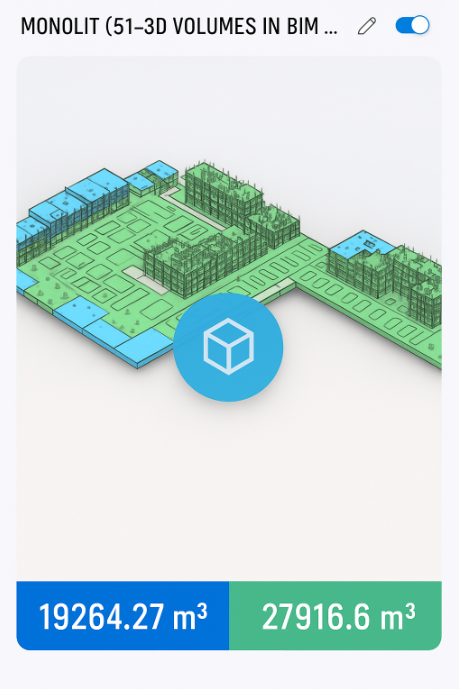
¶ Card settings
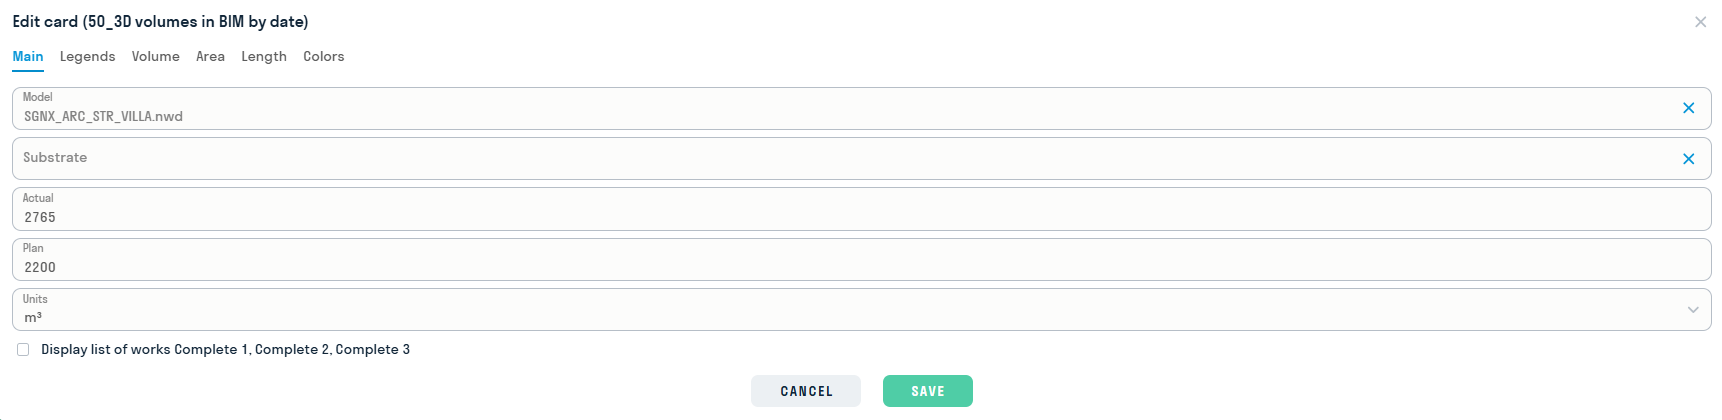
In administrator card viewing mode:
1-create a picture for the card splash screen
2-link volume data to preview
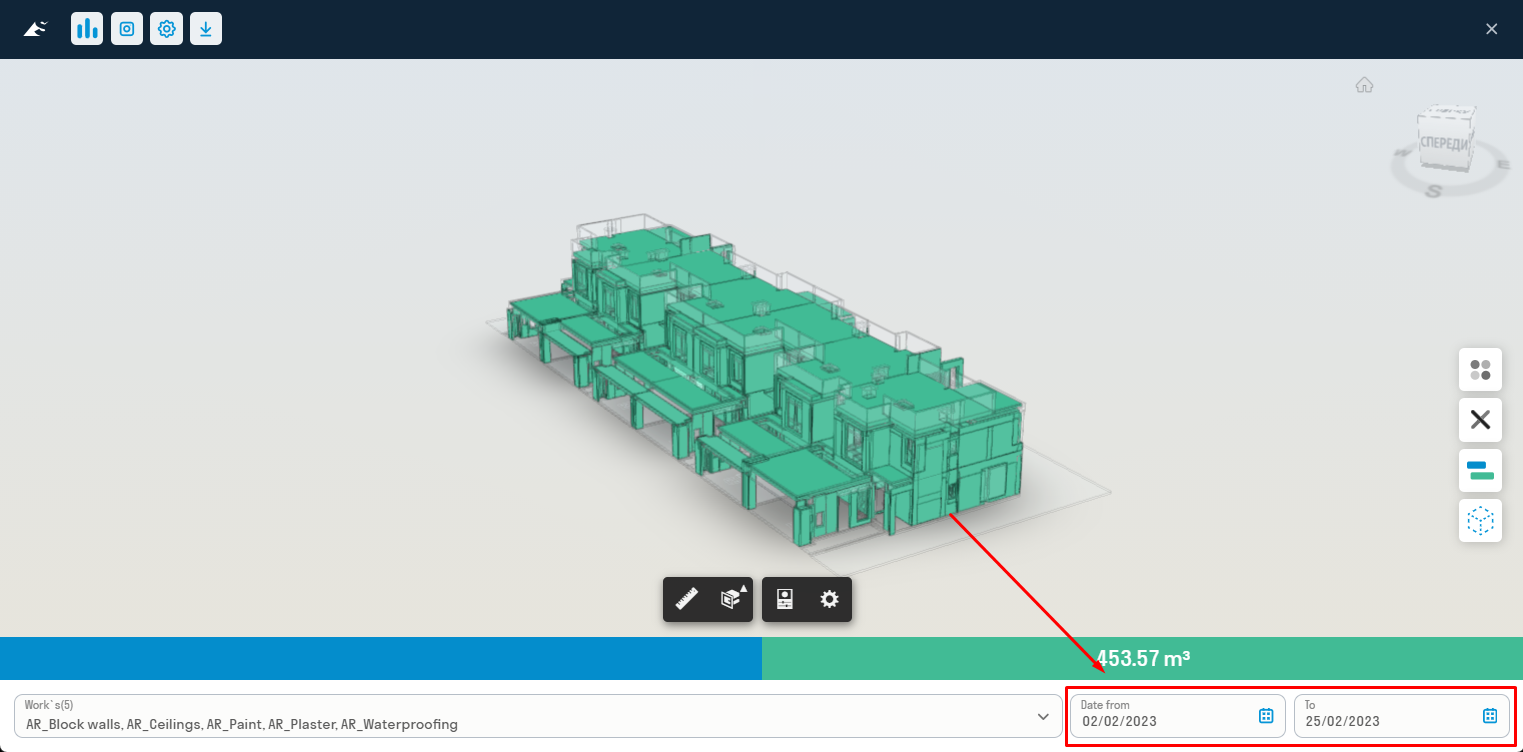
¶ 51. 3D volumes in BIM for a period
allows you to view the 3D construction model, as well as calculate the planned/actual volume of lead/lag in the volume of work performed for the specified period.
Displaying the card in user mode
Setting up and operating the card is similar to 50_3D BIM volumes by date
Difference: in calendars, you must mark the start date of the period and the end date of the period to view the volumes.
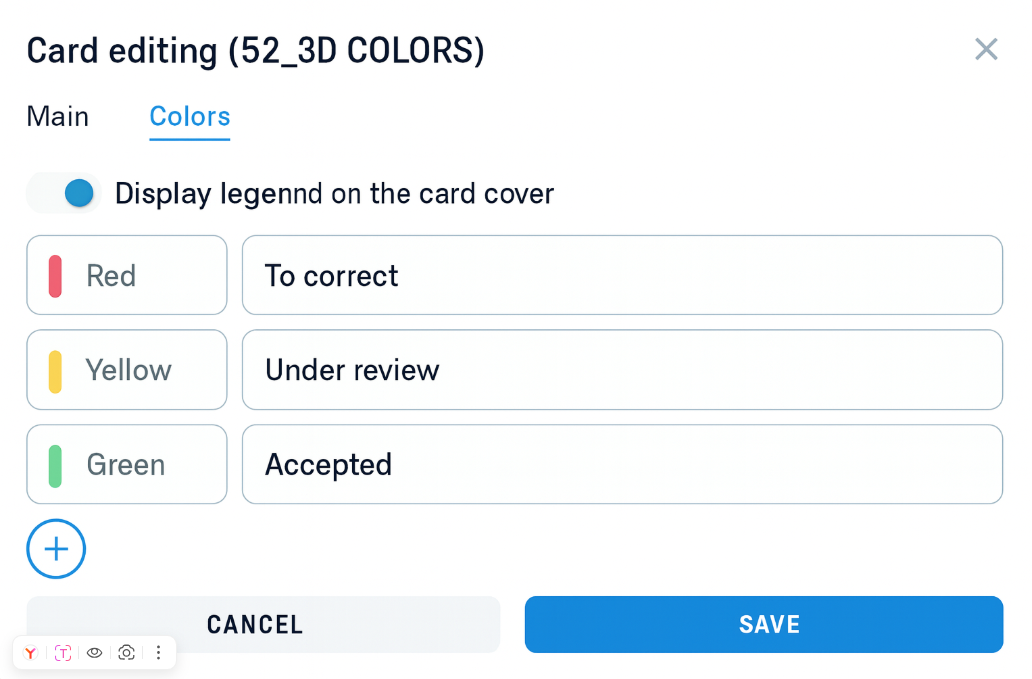
¶ 52. 3D Colors
The card allows you to split and highlight elements by system colors set in Navisworks.
Displaying a card in user mode
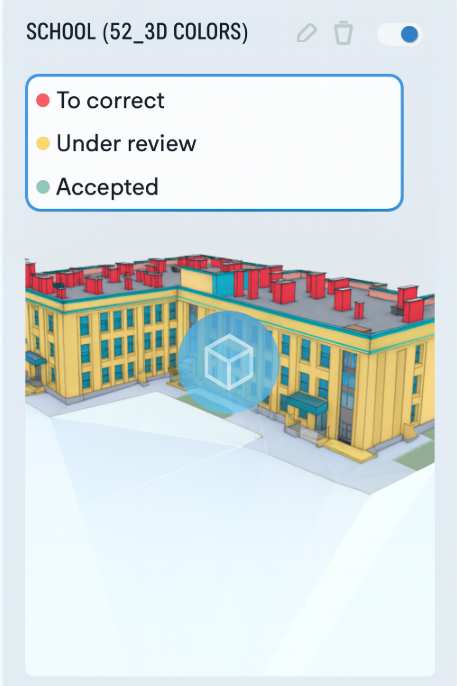
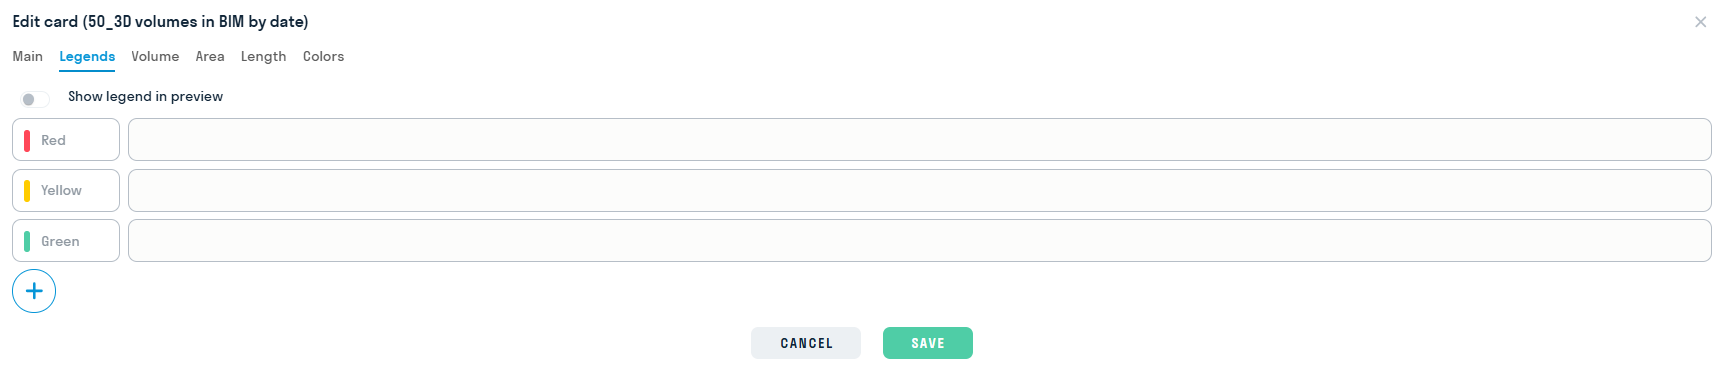
When editing a card, there will be two tabs: “Basic” - where you need to specify the nwd file stored in DOCS and “Colors” - where three system colors (red, yellow, green) are automatically given. To the right of the color cell, enter the desired text that will be displayed in the card legend.
When opening the card itself, the model and its color legend, which the user previously edited, will be shown. Colors in DASH are automatically linked to the colors set using the Coloring function in Navisworks.
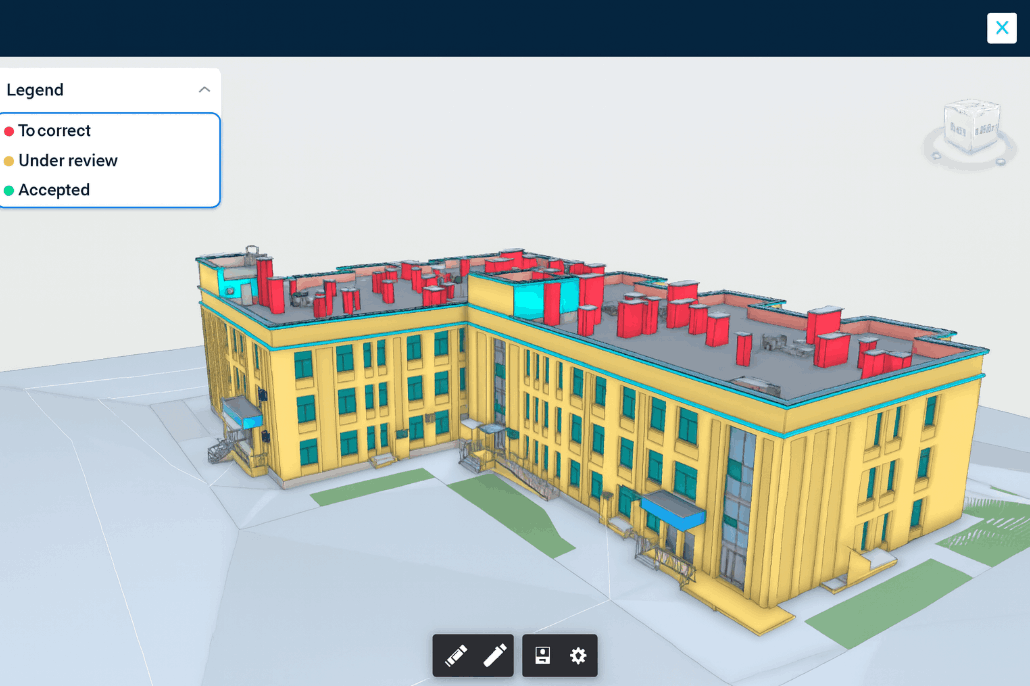
Clicking on any color in the model legend will show only those elements that have this color.
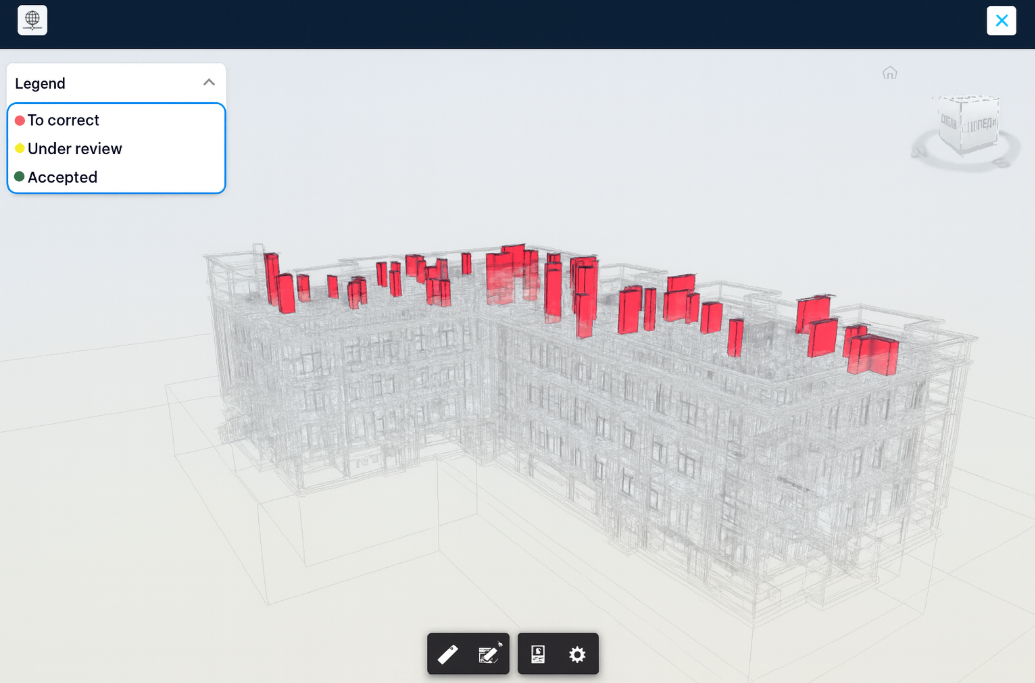
To restore the entire model, click on the selected color again.
< DASHBOARD. Cards 40. Volumes | DASHBOARD. Cards 60. DOCS >