< TOOLS FOR NAVIS. Creating a PN | TOOLS FOR REVIT. Settings >
A comprehensive tool that allows you to create a work production schedule in the form of a Gantt chart using a convenient graphical interface, and also visualize the construction of a model based on the created schedule
¶ General algorithm for working with the tool
- First, on the Work Schedule tab, you need to create or import aggregated work types from MS Project or Primavera in XML format. These activity types were previously agreed upon in the contract and are needed to track the start date of detailed activities.
- Then create or import detailed activity types that are linked to model elements using creation conditions (see conditions for creating work types for more details). These activity types will be used to create a Network Schedule.
- Open the Calendar and set up working days and weekends in accordance with the production calendar on site.
- Go to the Network Schedule tab and create a network schedule using nodes. Aggregated activities are the initial nodes and serve as a starting point for detailed activities. Drag nodes with activities into the network schedule area and connect them sequentially, specifying the duration of the activities. If necessary, you can add daily offsets, for example, for concrete curing.
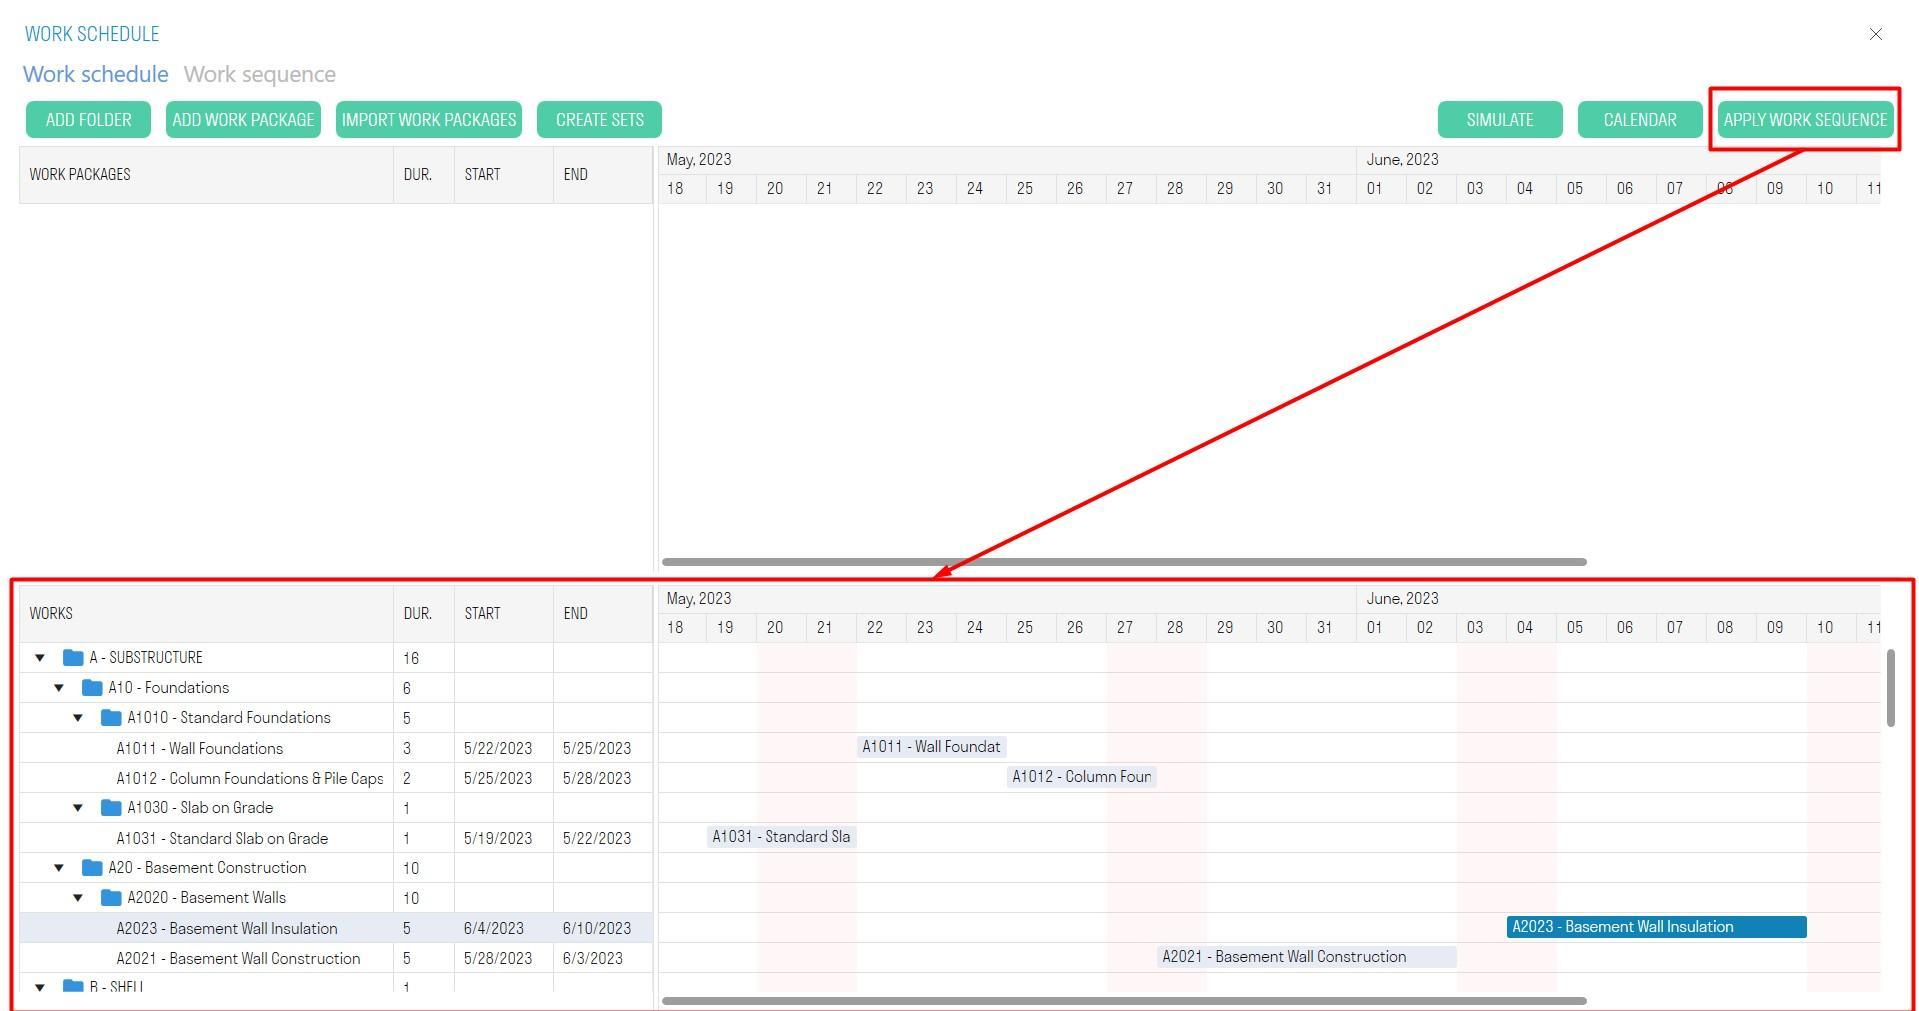
- Once the Network Schedule is ready, return to the Work Schedule and click "Apply Network Schedule". Thus, a Gantt chart for detailed types of work will be built at the bottom.
This schedule can be visualized in the
model
¶ WORK SCHEDULE TAB
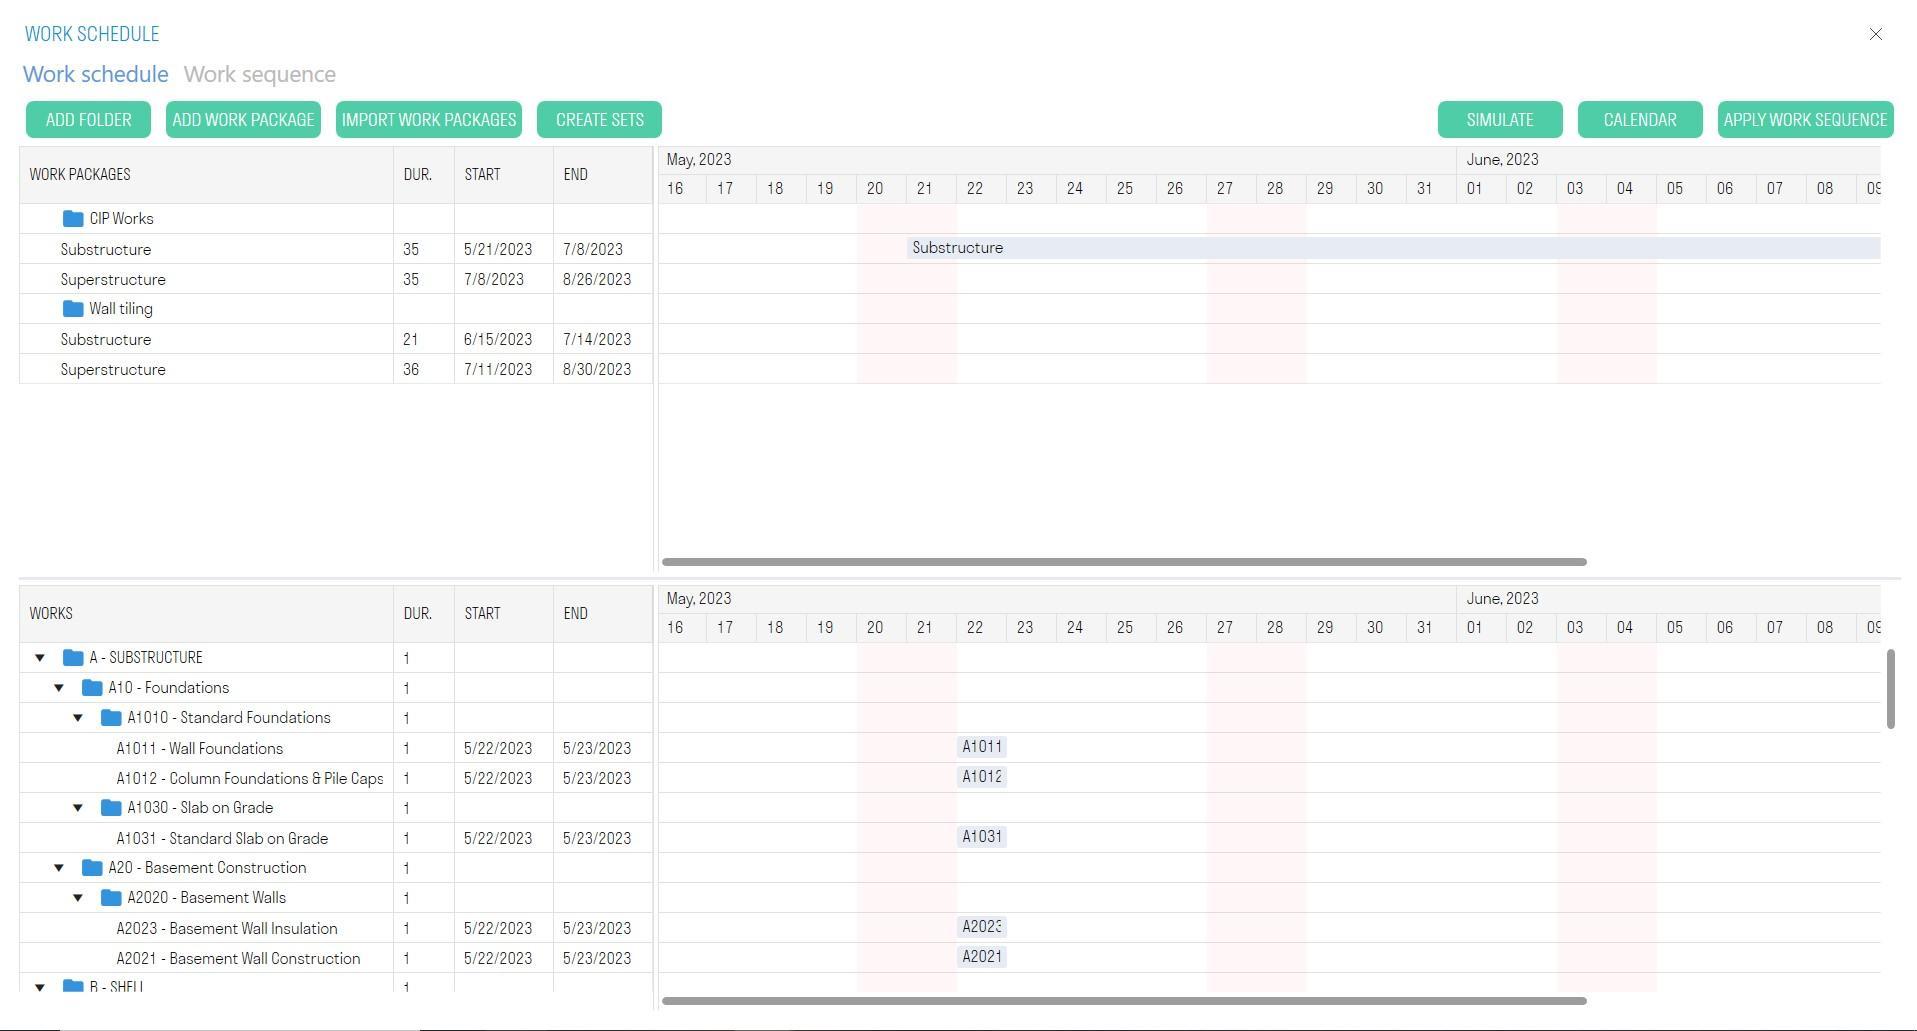
- The upper part contains the consolidated tasks that were agreed upon in the general contract, and a Gantt chart for the consolidated tasks. These tasks are needed to link detailed tasks to them.
- The lower part contains the detailed types of work linked to elements and a Gantt chart for these tasks. Based on these tasks, a network schedule will be built, which in turn will be used to build a Gantt chart
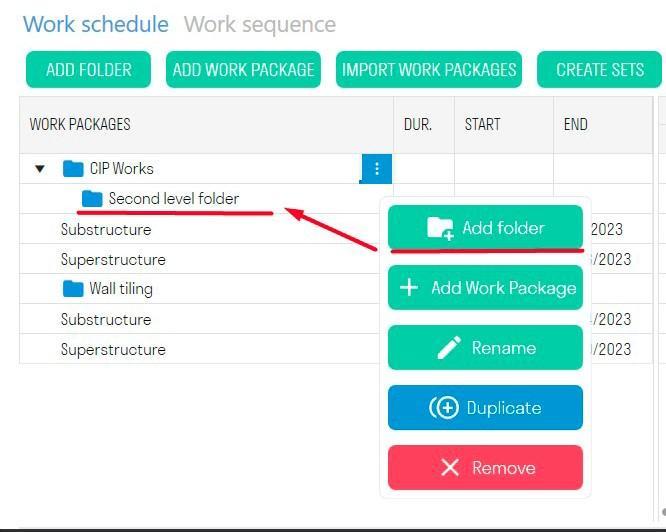
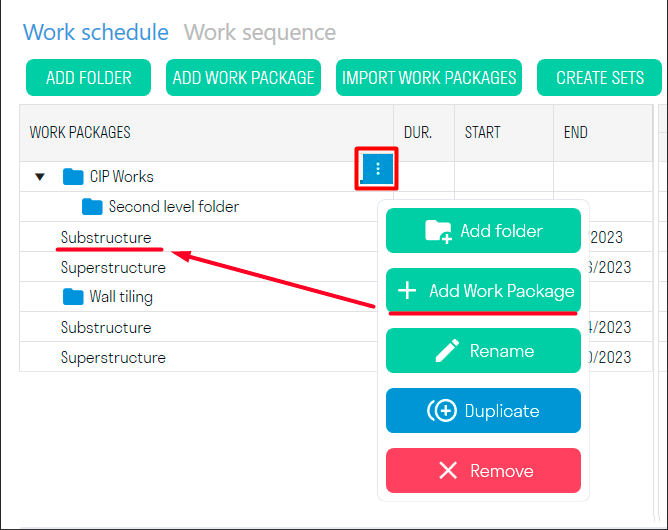
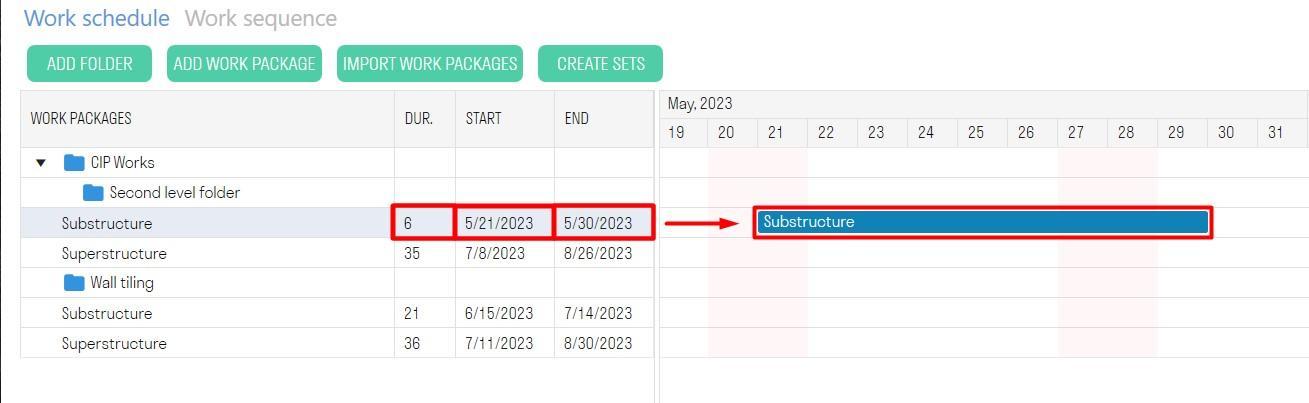
¶ Creating enlarged tasks
Method 1 - Manual creation
1. Click “Add folder” in the top panel to create a folder for enlarged tasks. The button located in the context menu creates a folder within a folder.
2. Click “Add enlarged task” in the top panel to create an enlarged task. The button located in the context menu creates a new task inside the
3. Specify the Start, Finish, and Duration of the task ➤ the new task will appear on the Gantt chart.
Method 2. - Import of aggregated activities
“Import of aggregated activities” allows you to import aggregated activities with linked dates from MS Project or Primavera in XML format
¶ Creating detailed activities
These activities are created in activity types (see Work types ) . Based on these activities, a network schedule will be built, which in turn will be used to build a Gantt chart. For visualization To build a model, and to view the volume of work, you must specify the creation conditions for these types of work (see Conditions for creating work types )
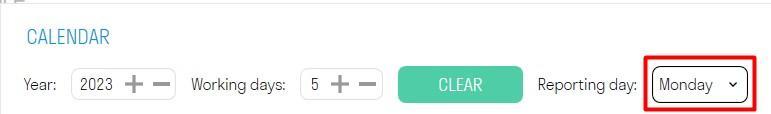
¶ Calendar
With flexible calendar settings, you can set working and non-working days in accordance with your production schedule. The duration of work depends on the work schedule, which means that the duration of work takes into account only working days.
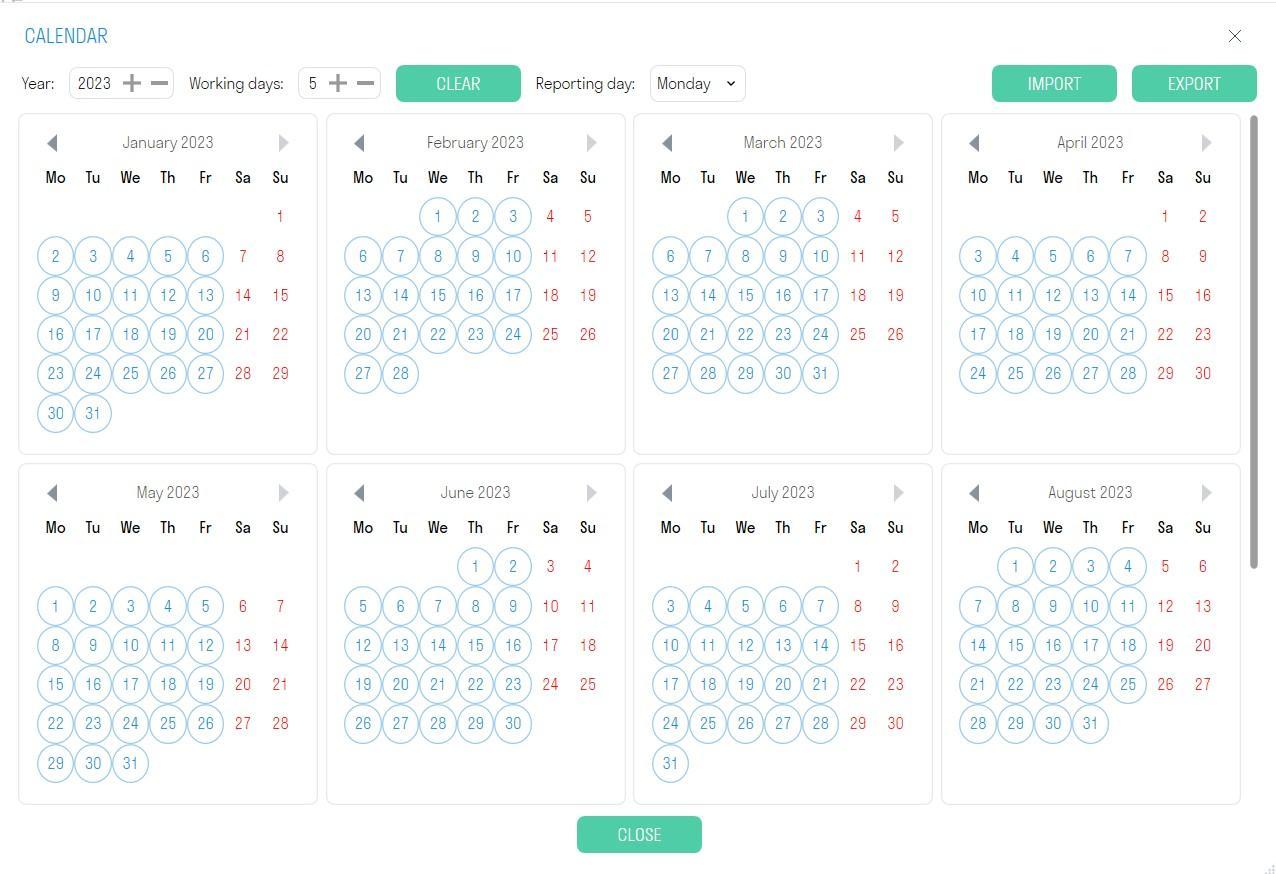
- In the "Working days" field, specify the number of working days per week for the project and click "Clear".
- For more flexible settings, click on a date in the calendar to make a day a working day or a non-working day
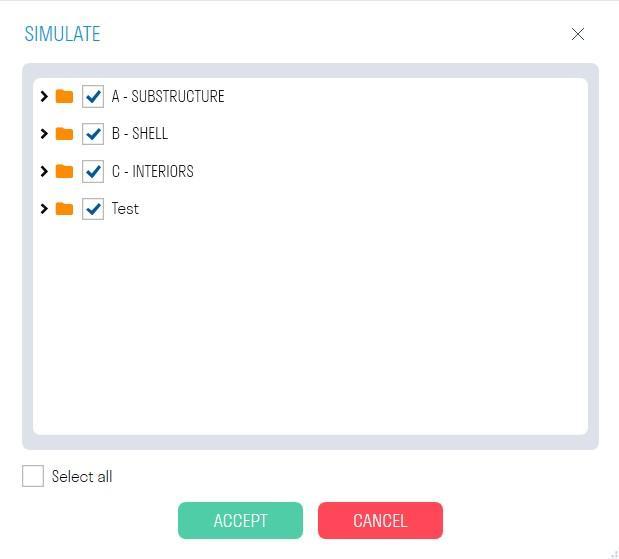
¶ Visualization
Visualization is a tool used to create timelines that show the sequence of construction of a building project. It allows users to visualize and analyze changes occurring in a project over a period of time.
You must first create search sets of activity types using the “Works” command.
1. Click “Visualization” and in the window that opens, check the boxes next to the activities you want to visualize. Then click “Accept”.
2. The visualization window will open. Select the visualization start date and step option (Day; Week; Month; End Date - the next step is switched by the end dates of the activities).
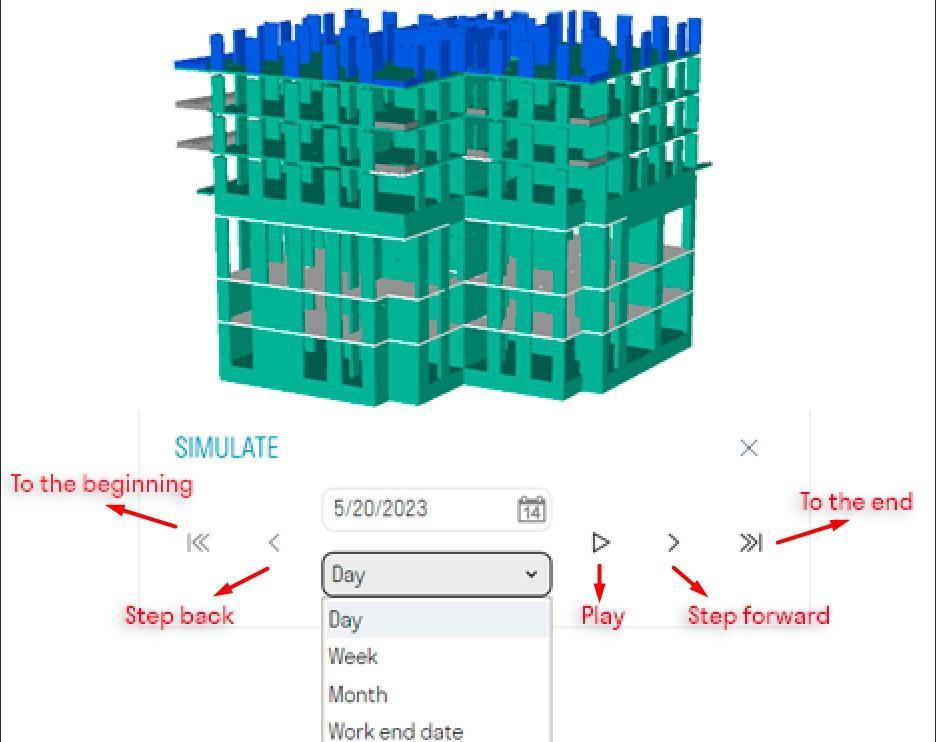
- Select the start date of the visualization
- Select the step option: Day; Week; Month; End Date - the next step is switched by the end dates of the activities. The reporting period in the Calendar determines which days will be displayed in the visualization with the Week step option.
- Run the visualization
¶ NETWORK SCHEDULE TAB
The network schedule allows you to plan the timing and sequence of construction of an object using nodes linked to aggregated activities. Nodes show a clear sequence of activities with their durations, which simplifies the creation of a Gantt chart.
Nodes are objects containing types of activities that are connected to each other to form a construction sequence for an object.
¶ Creating nodes
The network diagram window is divided into three parts: at the top left are the enlarged activities, at the bottom left are the detailed activities, and on the right is the work area with nodes.
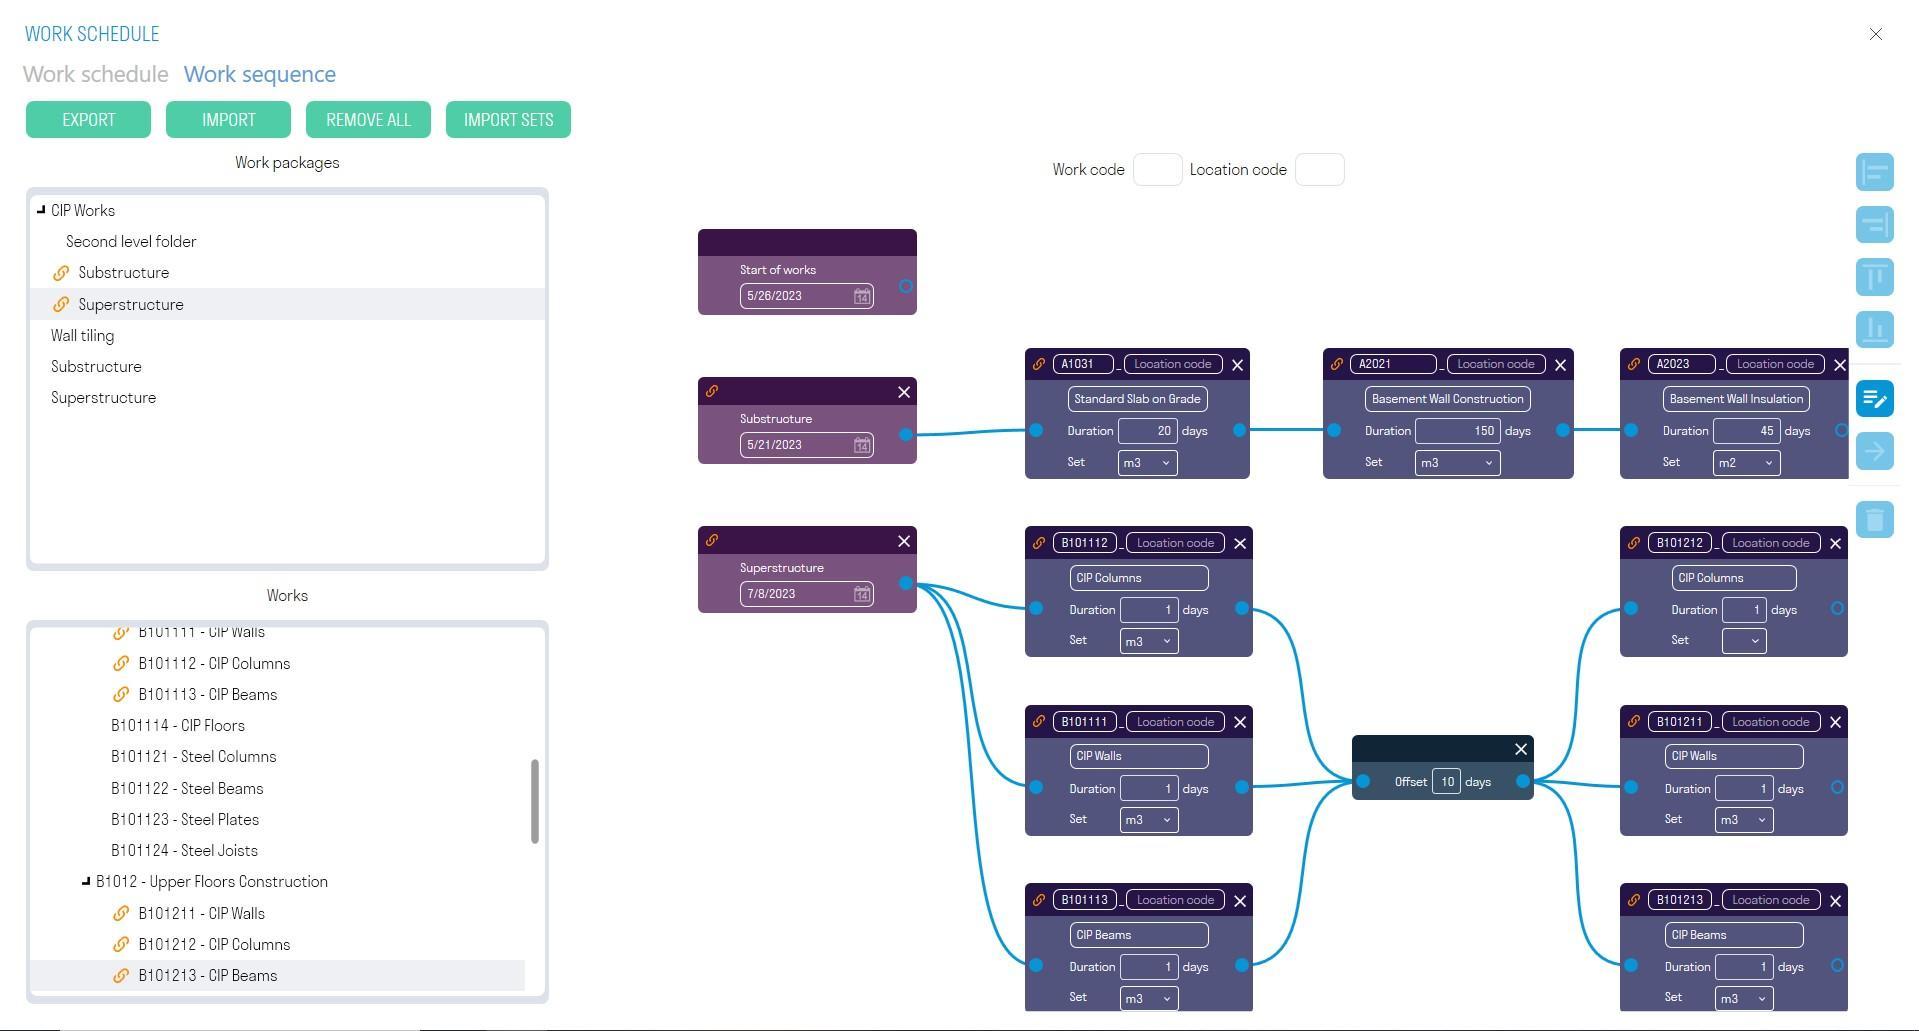
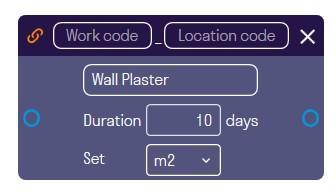
1. Drag the enlarged activity to the work area
A node with an aggregated job will be created. This node displays and specifies the start date of the work, for example, the start of monolith installation above zero. This start date is taken from the aggregated jobs that you previously imported in the Work Schedule tab
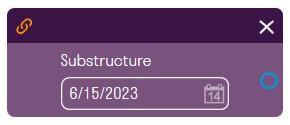
If you need to create a work schedule for one type of work, for example, only Monolith or only Masonry, you can use the "Start of Work" node. This node is not linked to aggregated jobs and is always located in the work area. Specify the start date of the work.

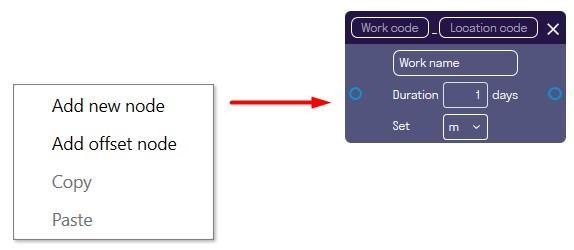
2. Drag the detailed job into the work area
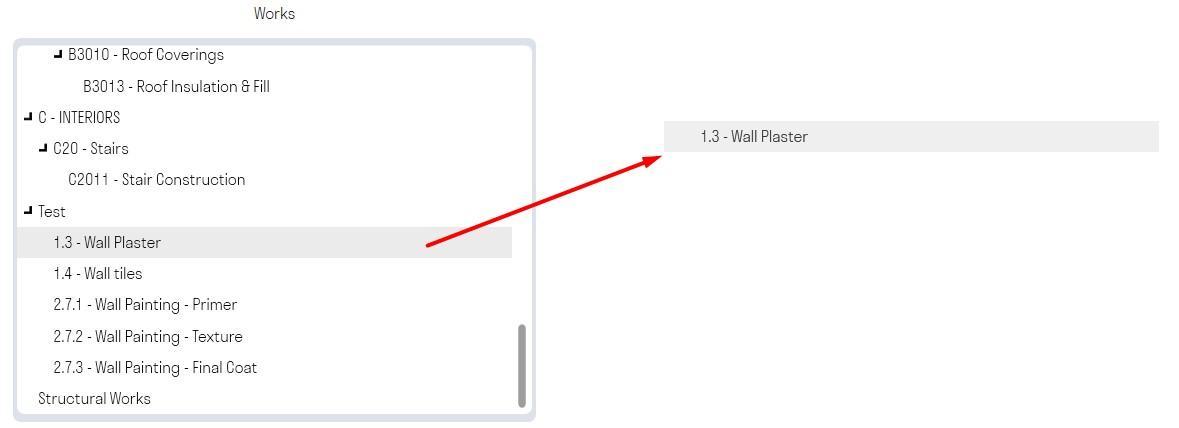
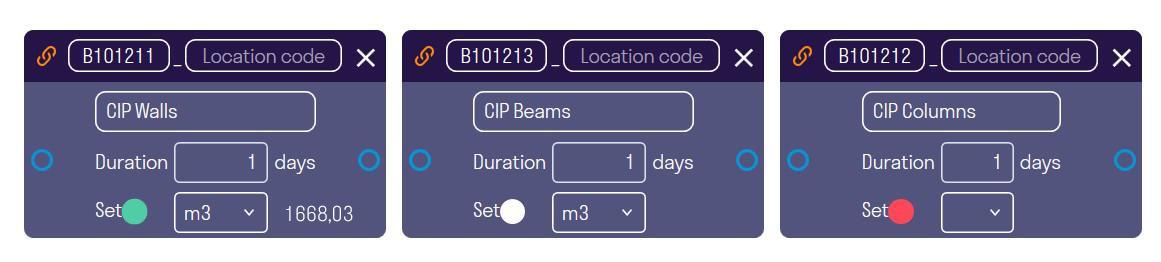
A node with a detailed task will be created. This node receives the task start date as input, adds the task duration to it, and outputs the task end date.
- Fill in the “Task Code”, for example, 4.1.1
- Specify the “Location Code”, for example, L01
- Specify the task duration and units of measurement
- The set is needed to track the volume of work according to the creation conditions (see the Work Volumes section)
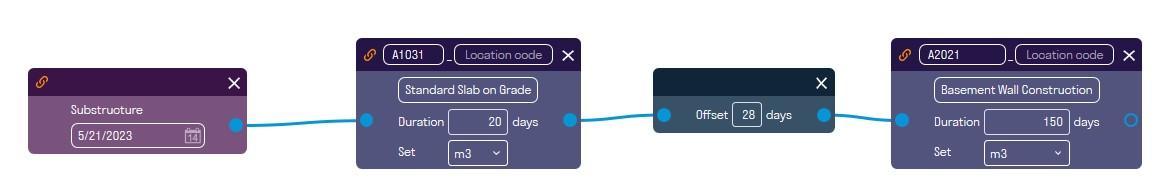
3. Connect the node of the aggregated task to the node of the detailed task. To do this, hover over the output of the aggregated task, hold down the left mouse button, and drag the connection to the input of the detailed task. This way, the node with the detailed task will receive the work start date as input.
Then connect the detailed job to the next detailed job, etc. Thus, in the example, we get that the installation of the walls of the third floor will begin after the installation of the second floor slabs is completed, which lasts 5 days.
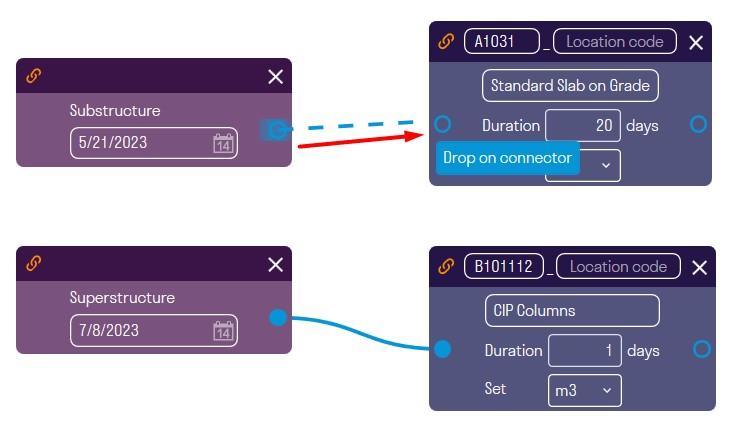
4. If necessary, set an offset for the start of the next job, for example, so that the next job begins after the concrete has gained strength.
Right-click in the work area ➤ Add Offset
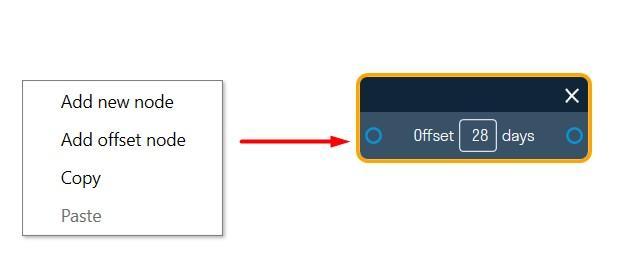
The offset takes the job completion date as input and adds the offset to it by calendar days and on output it gives the start date of the next job.
Set the offset and connect it with the jobs
5. It is also possible to create your own node, which will not be associated with the types of work in the SIGNAX panel and will not be taken into account in calculating volumes, but is necessary for taking into account the work when building a work schedule.
Right-click in the work area ➤ Add new node
This node does not show volumes, since the work is not specified in the SIGNAX panel and it is impossible to specify the creation conditions for it.
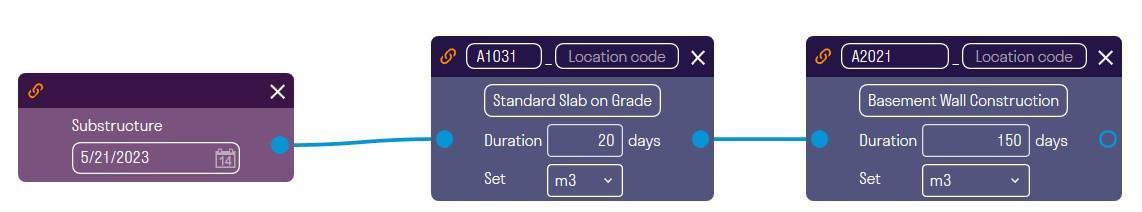
6. On output to one Several jobs can be connected to a node, for example, to set up parallel installation of building facades
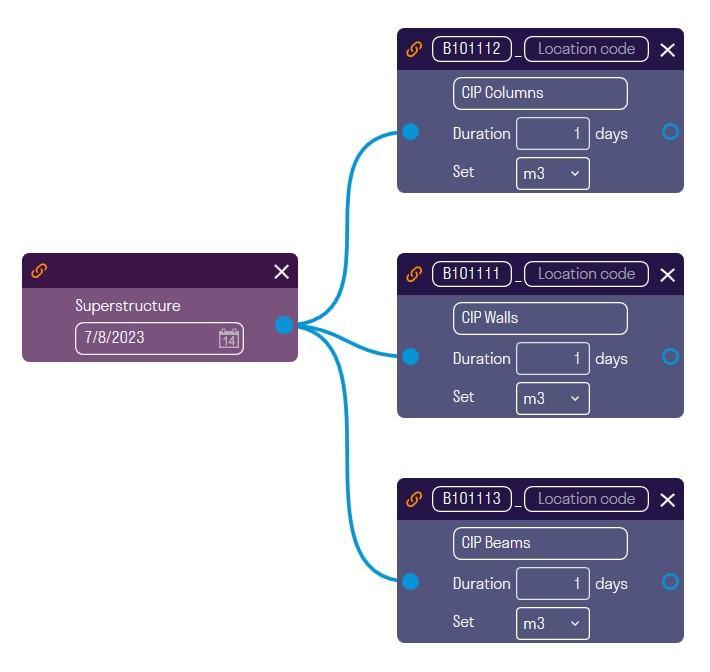
- Several jobs can be submitted to the input of one node. Then the job will start according to the latest completion date of the connected jobs.
7. Continue connecting jobs one after another as they should proceed on the construction site, specifying the duration of the jobs and, if necessary, time shifts.
8. After completing the network schedule, go to the “Work schedule” tab and click “Apply network schedule”. Thus, a Gantt chart for the specified jobs will be built based on the data from the network schedule
¶ Work volumes
To determine the volume of work, you must fill in the conditions for creating work types in the SIGNAX panel in the work types (see Creation conditions).
1. On the Network Schedule tab, click “IMPORT MON”
2. The work volumes and corresponding statuses will appear on the nodes:
- MON found in the current project. This work type is present in the work types in the SIGNAX panel and its creation conditions are filled in correctly.
- MON found in the current project, but the volume is 0. This work type is present in the work types in SIGNAX panel, but its creation conditions are filled in incorrectly or are missing altogether.
- The PN was not found in the current object. This activity type is not included in the activity types in the SIGNAX panel, but was created exclusively in the work schedule.
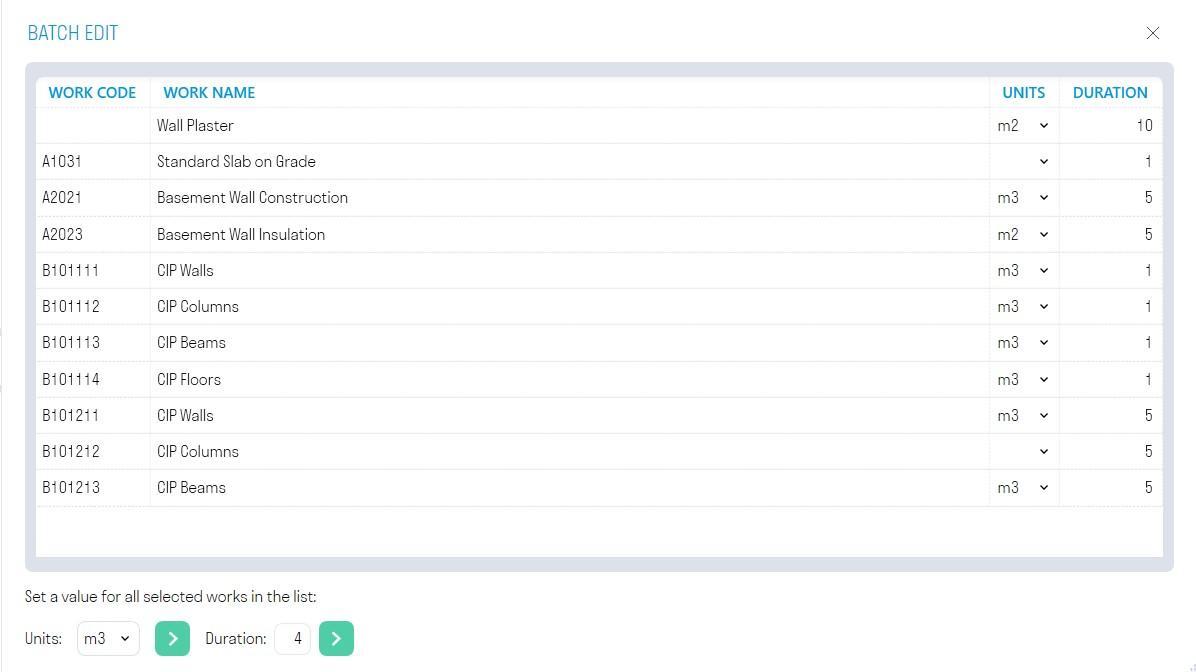
¶ Batch Editing of Nodes
Batch editing of nodes allows you to set units of measurement and duration for several nodes at once.
Click

on the right side of the network diagram workspace
Batch Editing of Nodes
-
In the list, select the nodes you want to edit.
-
At the bottom, in the “Units” line, select the units of measurement you want to assign to the selected nodes and click
-
At the bottom, in the “Duration” line, specify the duration you want to assign to the selected nodes and click
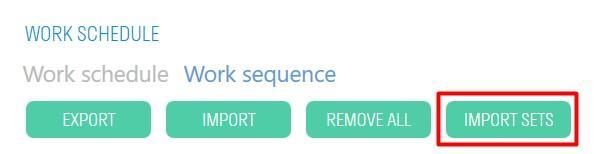
¶ Importing and exporting nodes
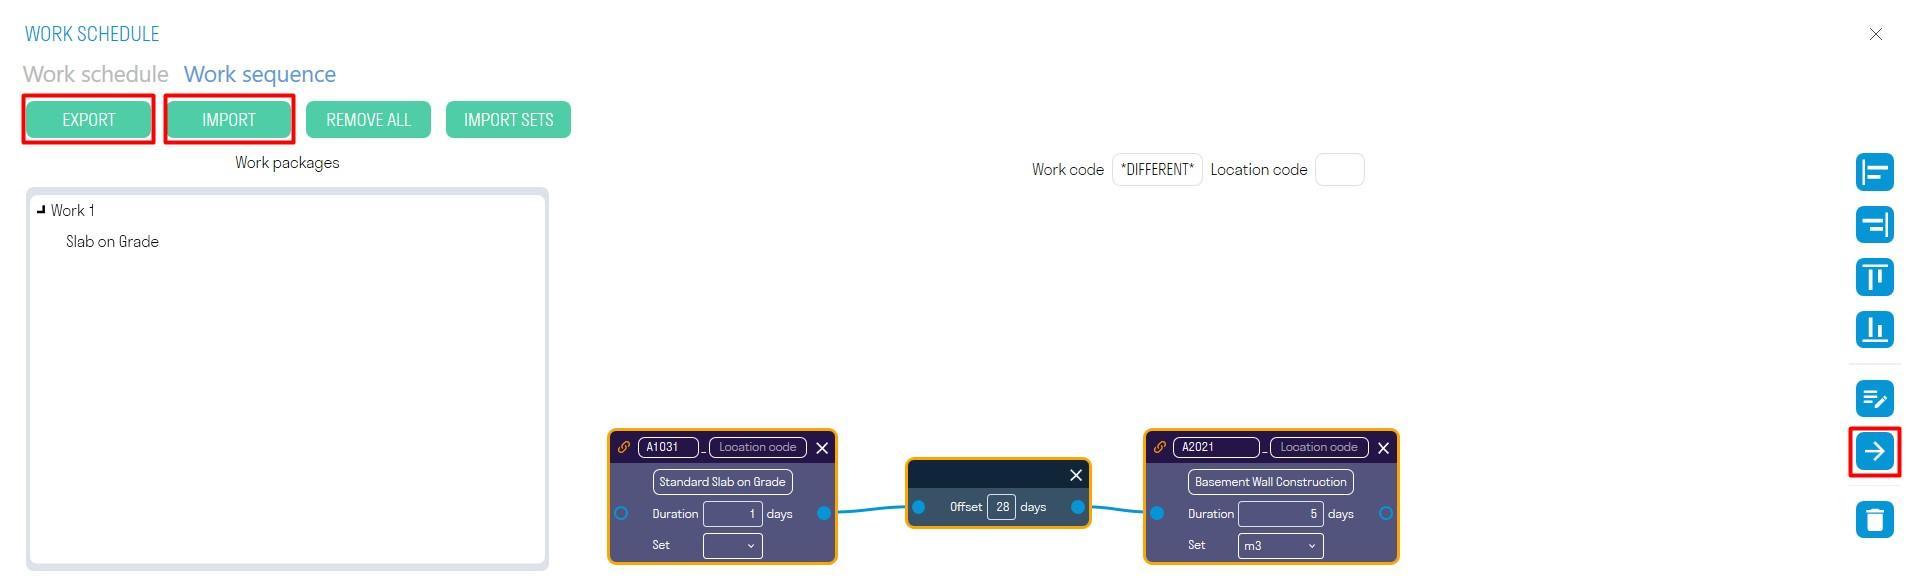
1. To export nodes in XML format, click "EXPORT". You can send these nodes to your colleagues.
2. To import nodes, click "IMPORT"
3. For export specific nodes, select the nodes and click

on the right side of the workspace
Aligning nodes
Use the alignment tools to align nodes vertically or horizontally.
Select the nodes and click one of the buttons on the right side of the workspace:
- Align to left edge of nodes
- Align to right edge of nodes
- Align to top edge of nodes
] - Align to bottom edge of nodes
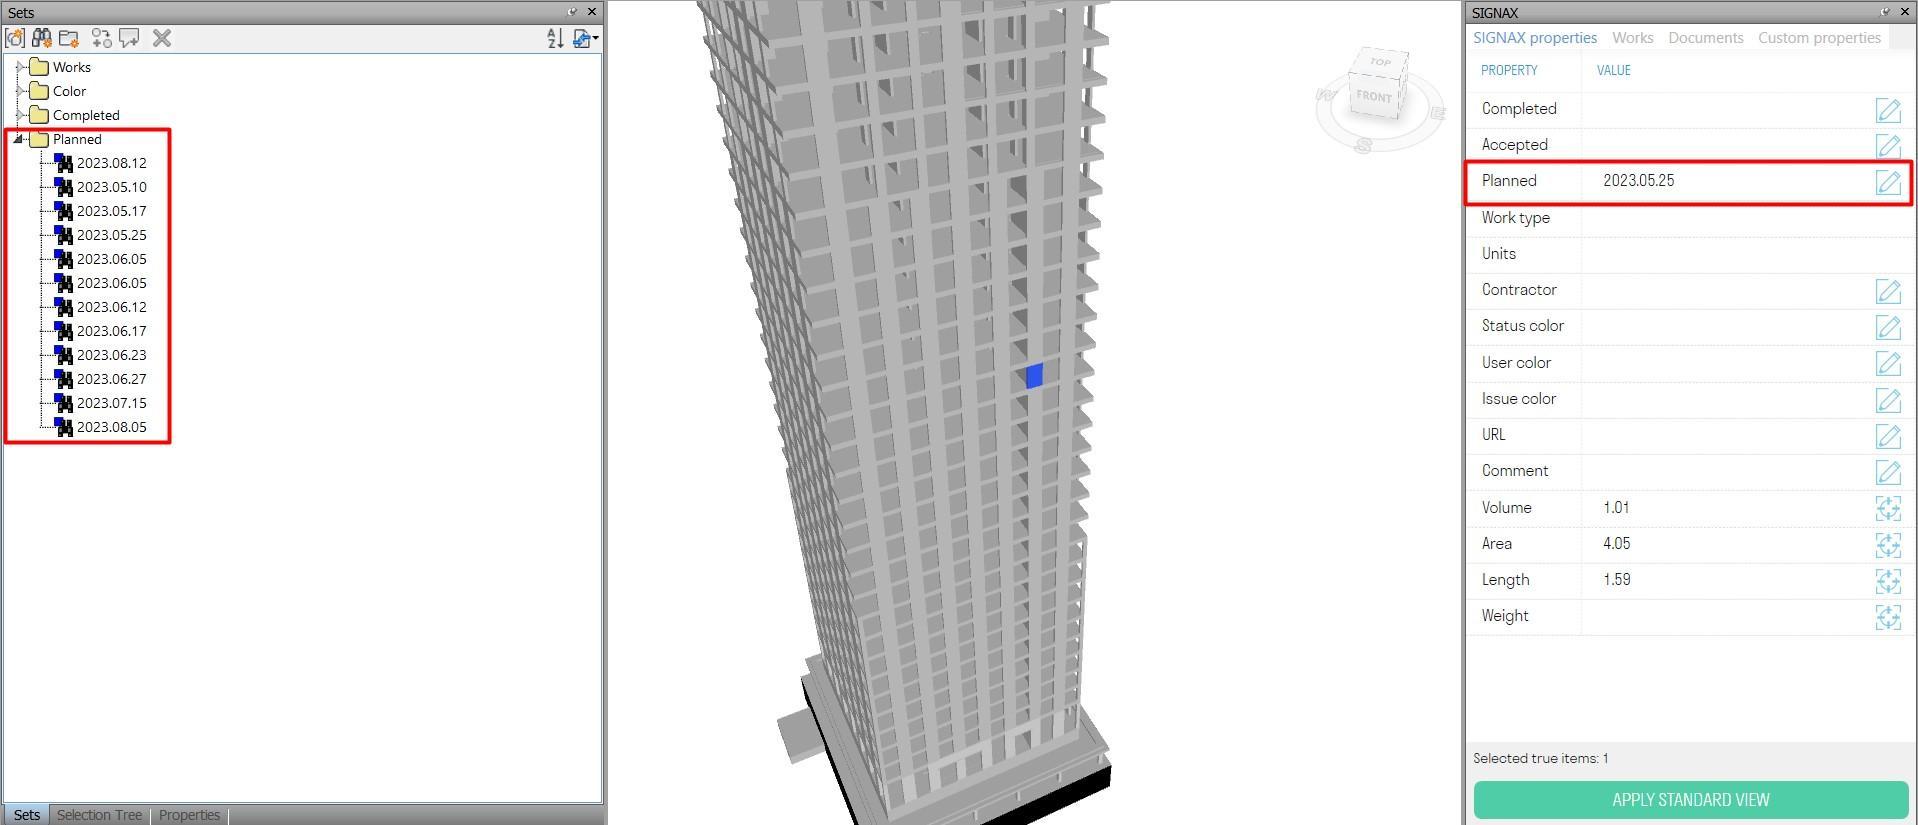
¶ Creating a Planned PN
The tool creates Planned search sets based on planned work completion dates, allowing this model to be loaded into the Plan-Actual cards of the DASHBOARD module as a model with planned work.
You must first create search sets of work types using the command “Works”
1. Click “Create PM”
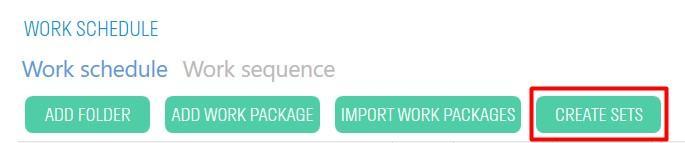
2. The Planned property will be created in the elements in the “SIGNAX” tab. Based on this property, corresponding search sets with planned dates will be created in the “Sets” panel. This model can be used as a planning model for cards “Plan-Actual” of the DASHBOARD module
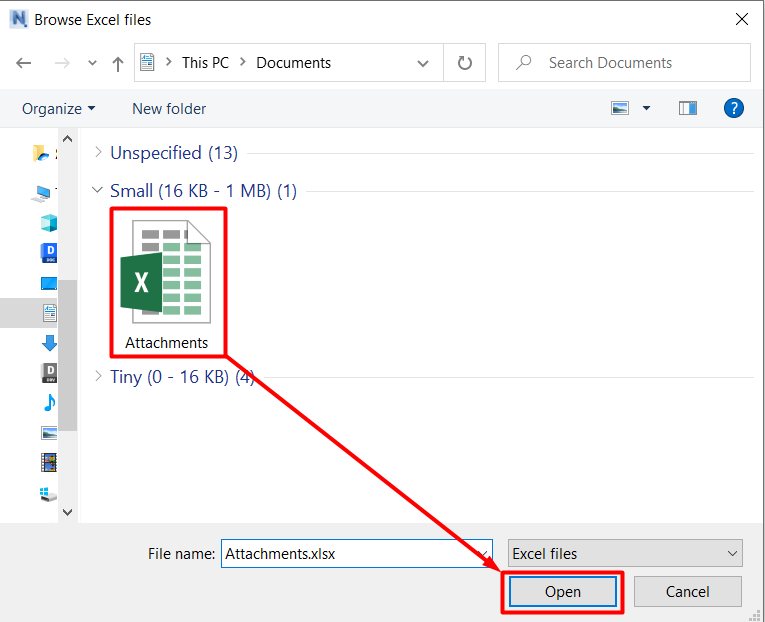
The tool allows you to attach documents to registry items in Excel.
1. Click on the SIGNAX PRO tab in the Utilities panel ➤ Attachments
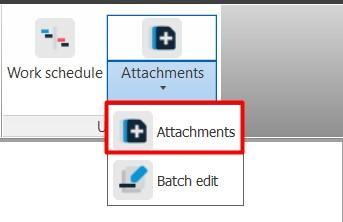
2. A file explorer window will open. Select the Excel file with the registry and click “Open”.

¶ Excel file structure

- In column A, specify the position of the document in the table, for example, 1,2,3, etc.
- In column B, specify the path to the file or folder. You can specify either the full path or the path after the root folder specified in Document Settings
- Starting with column C, in row 1, list the properties as a “Category-property” pair, by which the plugin can determine the elements to which you want to attach documents.
- At the intersections of paths and properties, fill in the cells with the values of the properties listed in the previous paragraph. Several filled properties for one Paths are specified using the "AND" operator.
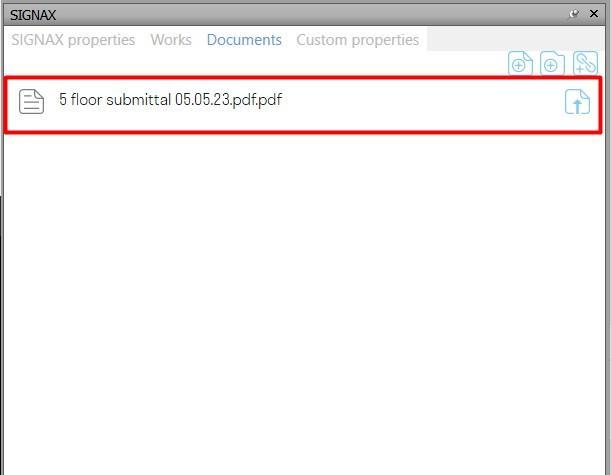
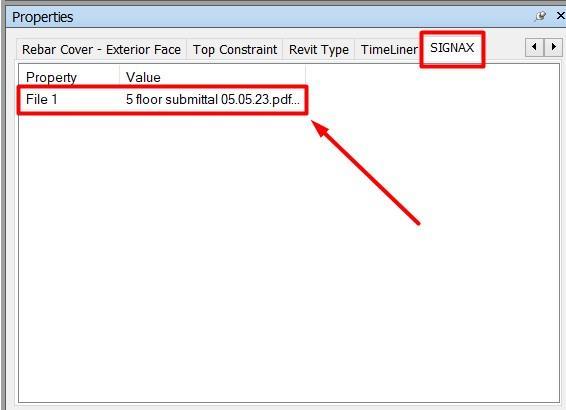
3. Documents specified in the registry will be attached to the elements. Attached documents can be seen in the SIGNAX panel in Documents tab or in the element's properties in the SIGNAX tab.
< TOOLS FOR NAVIS. Creating a PN | TOOLS FOR REVIT. Settings >