< DOCS. Additional | DASHBOARD. Cards 10. General >
¶ 1. User's personal account
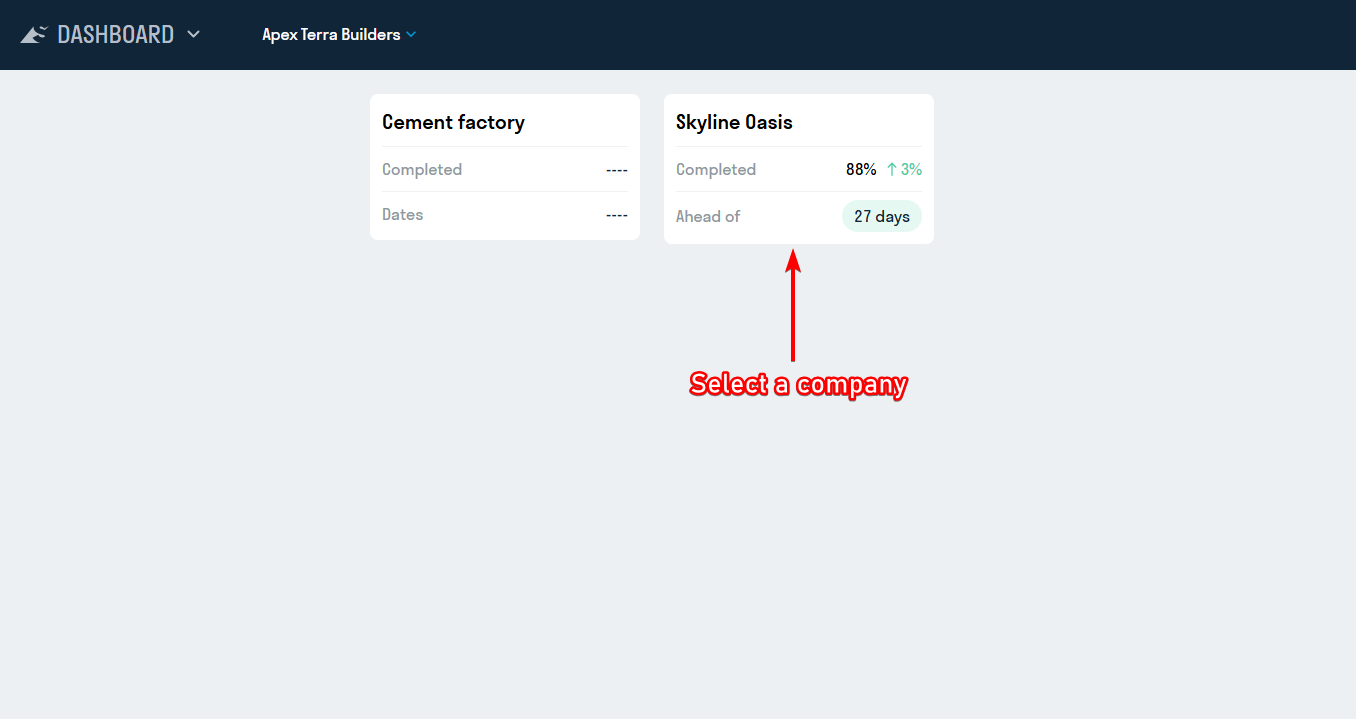
Select a Company and open a Project from the list of available ones. Brief information on the status of each project is displayed for each project, which is configured by the Project Administrator.
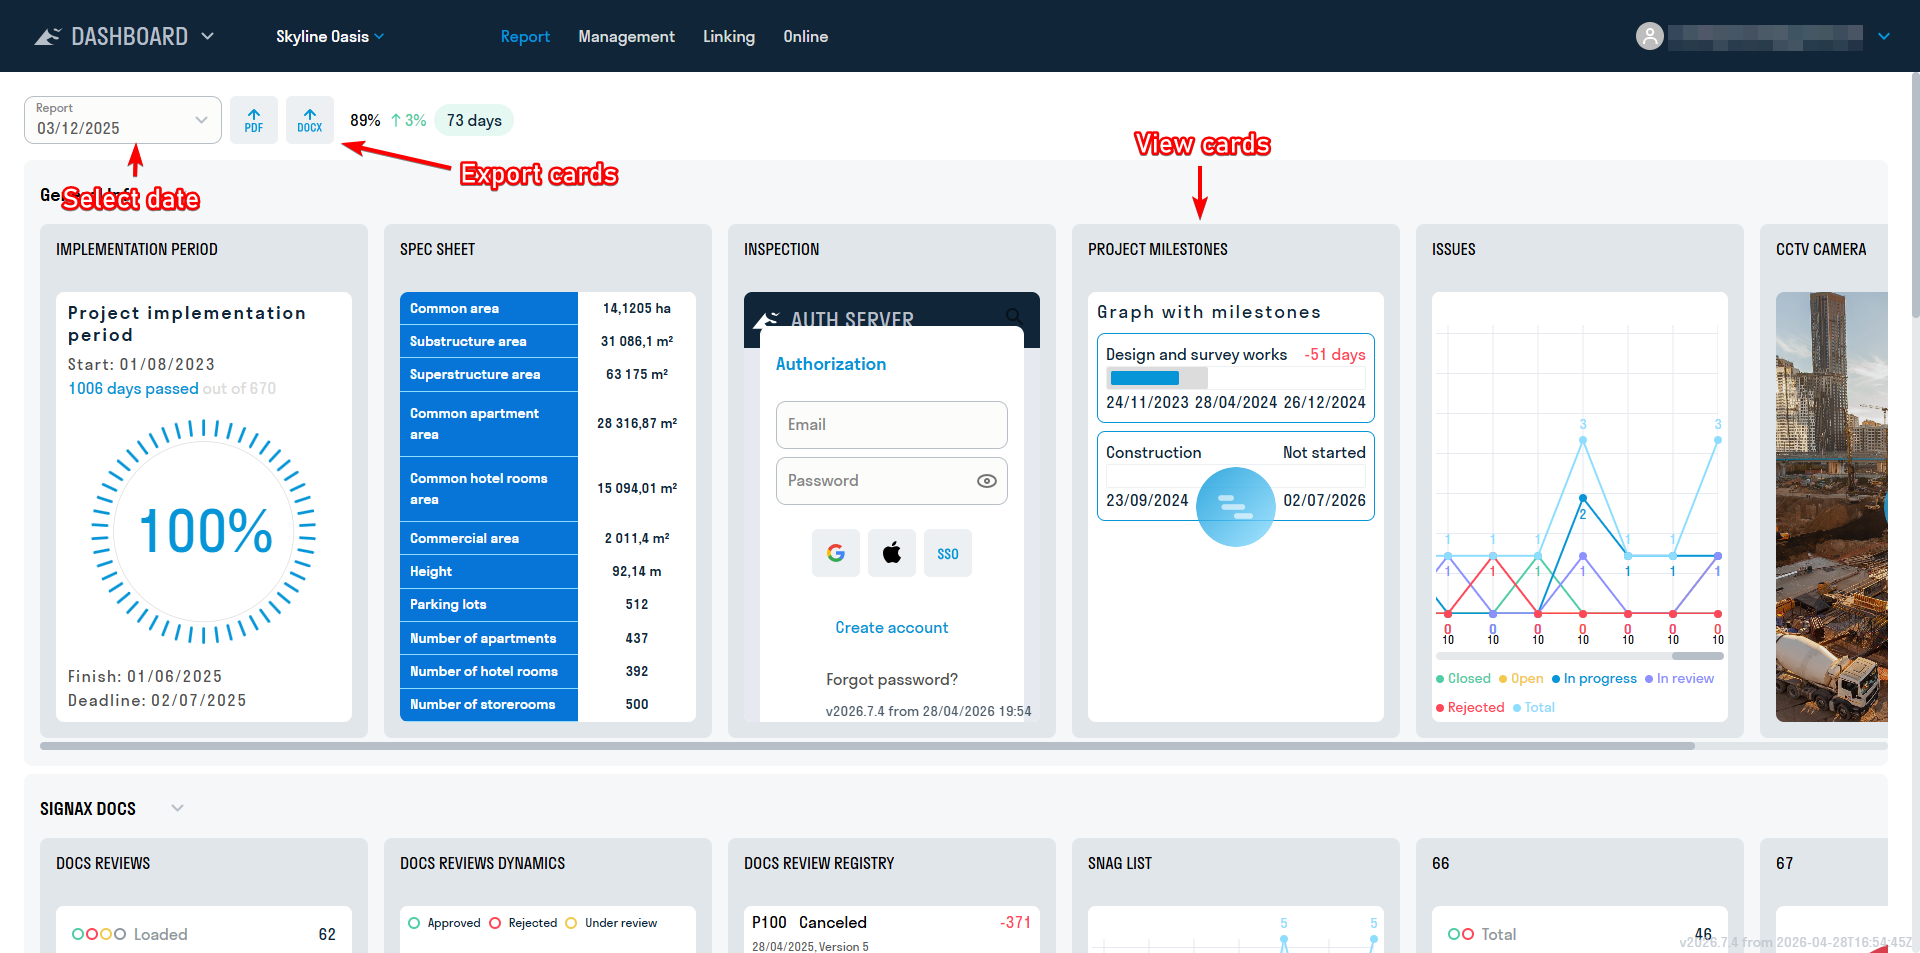
The user has access to the “Report” section, which displays published reports with cards for the selected date. Some cards can be opened, while others only show information in preview. The purpose of all cards can be found in the “Instructions”.
¶ 2. Creating a Report
personal account. Report cards can be created and edited at dash.signax.io in the "Management" section. A SIGNAX account with a DASHBOARD license is required to access the personal account.
Adding users to a project and managing access rights to view specific projects is done through the SIGNAX HUB admin panel.
Logging into the personal account is the same as for users. In addition to the "Report" section, the Administrator has access to the "Management" and "Linking" sections for creating and configuring cards.
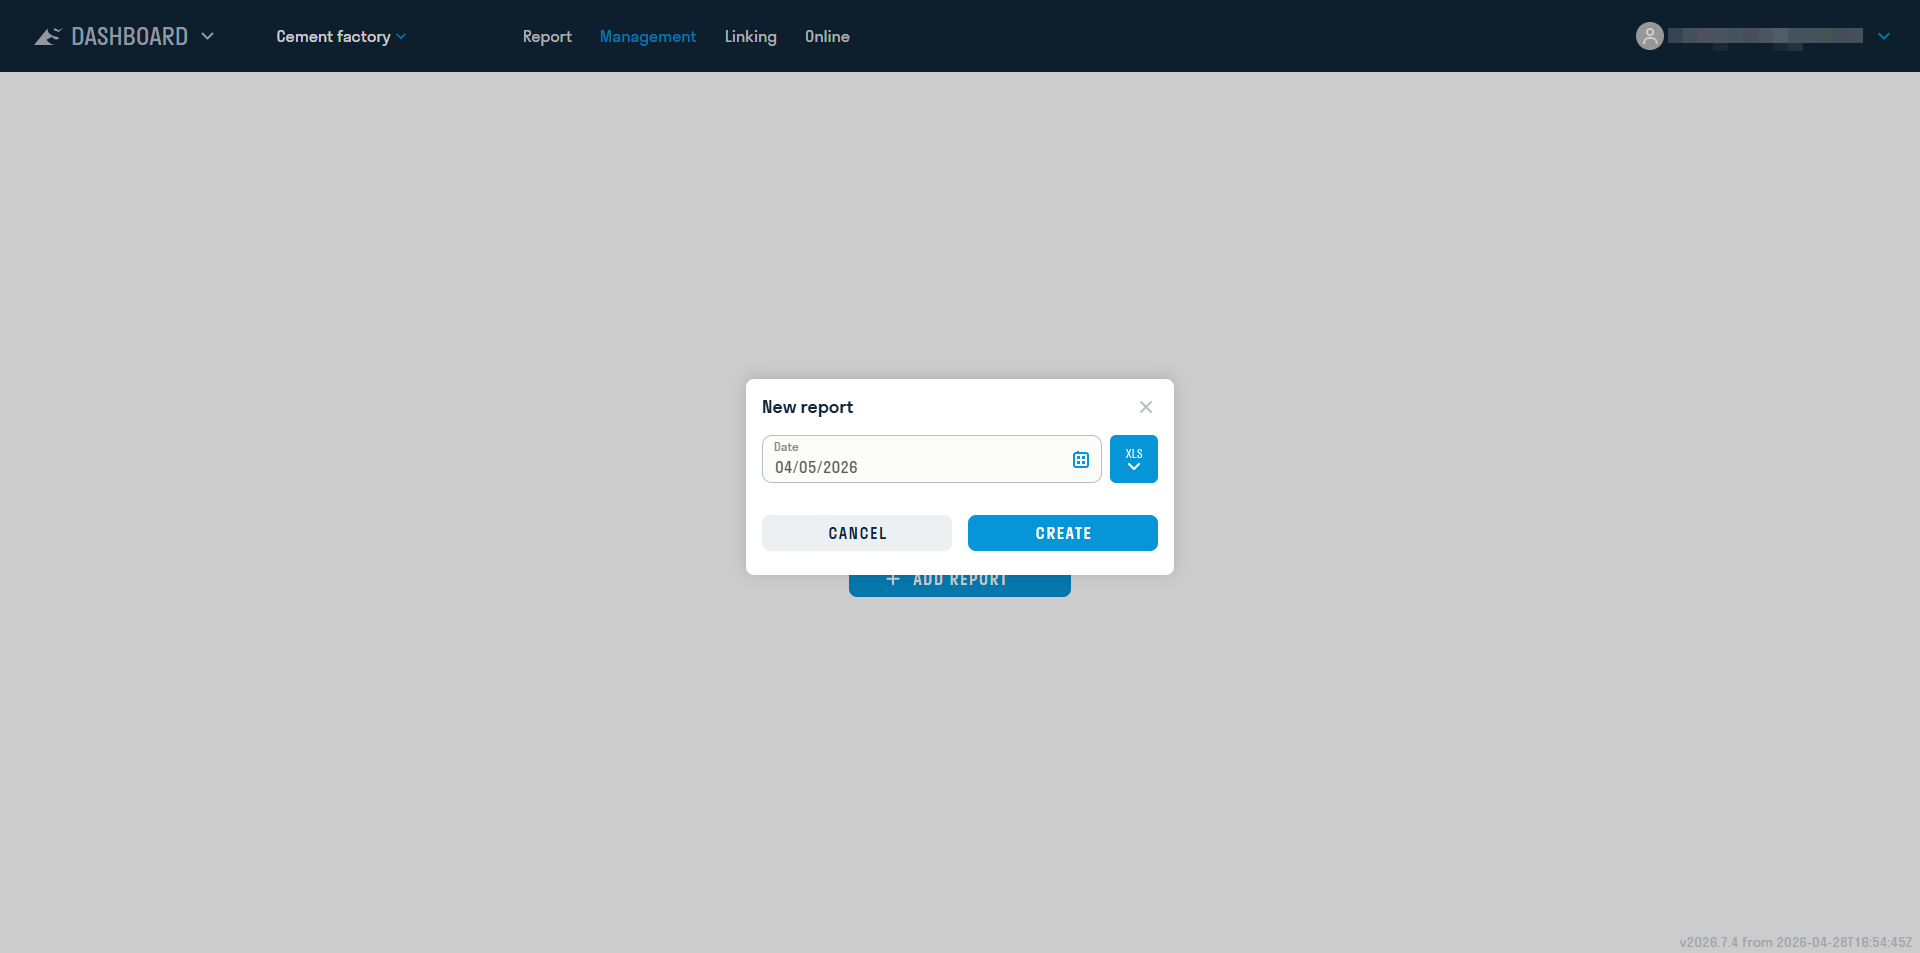
When opening a new project for the first time, you will be prompted to create a report. Enter the report date and click "Save."
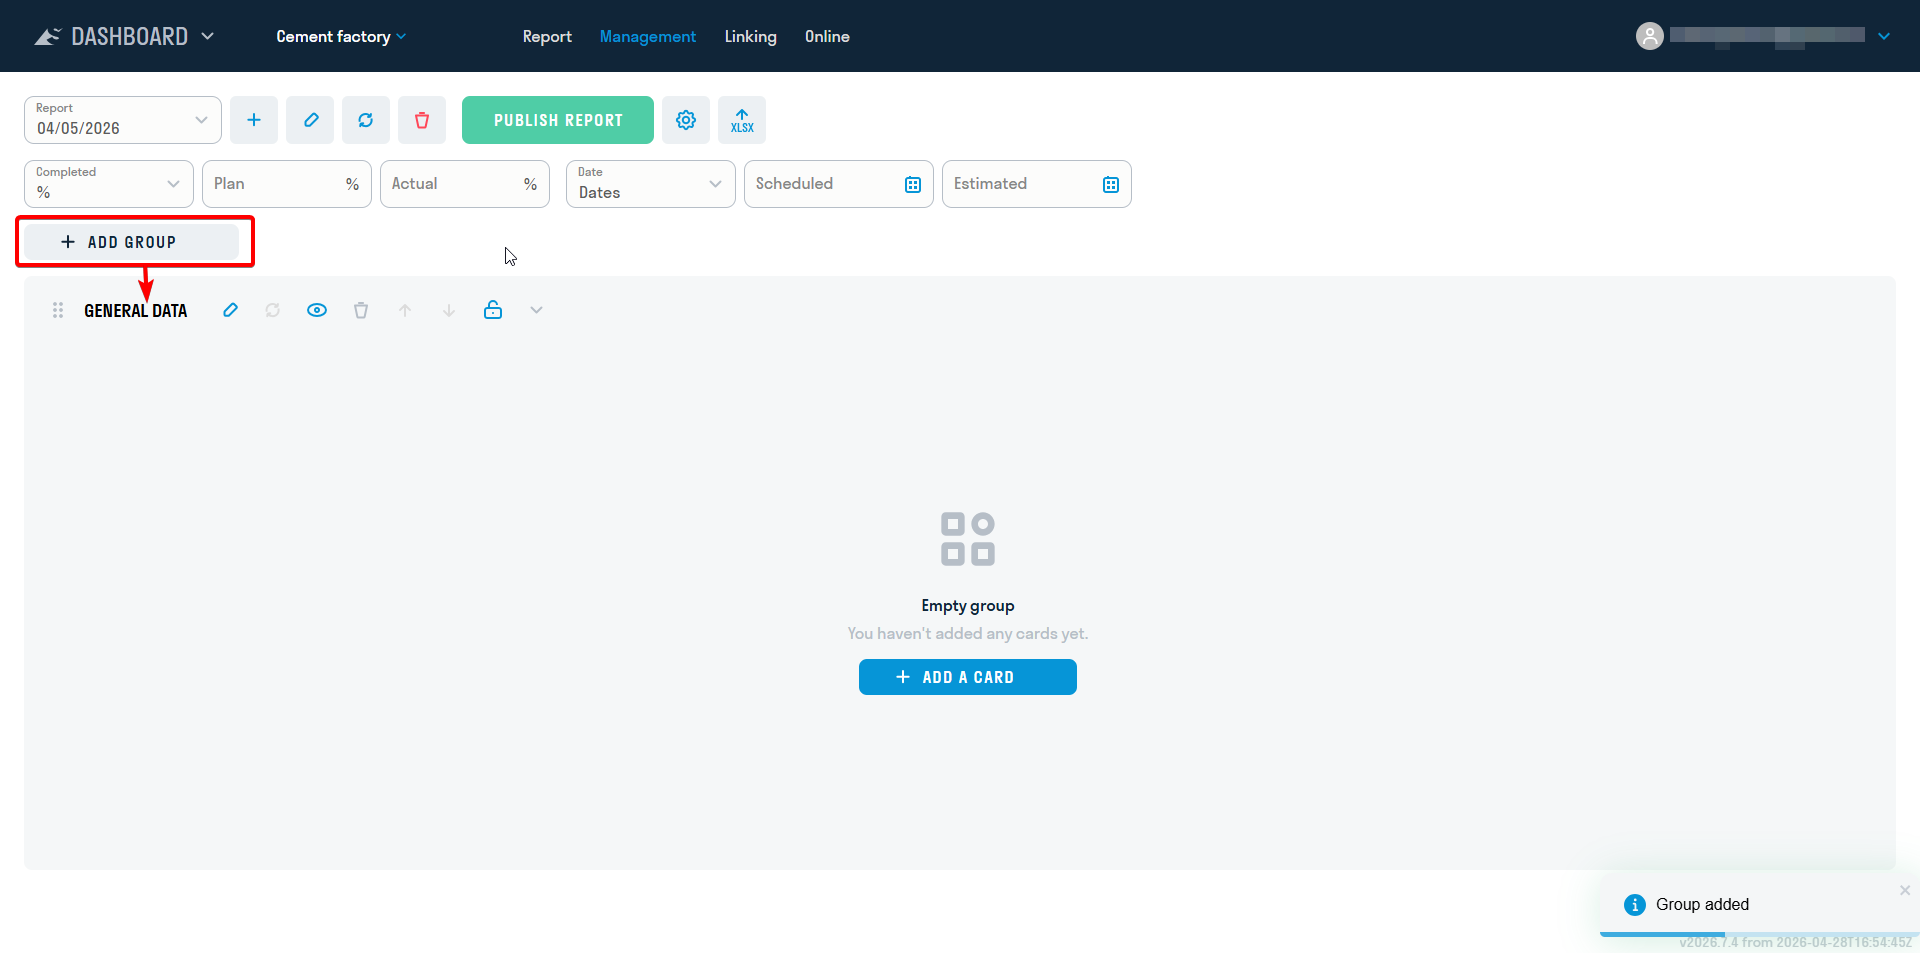
Adding and editing cards is performed in the “Management” section.
First, you need to create a group. Using groups, you can divide cards into different construction sections, locations, etc., for convenient navigation through the report.
To create a group, enter its name, for example, GENERAL DATA, and click “+”.
Editing a group:
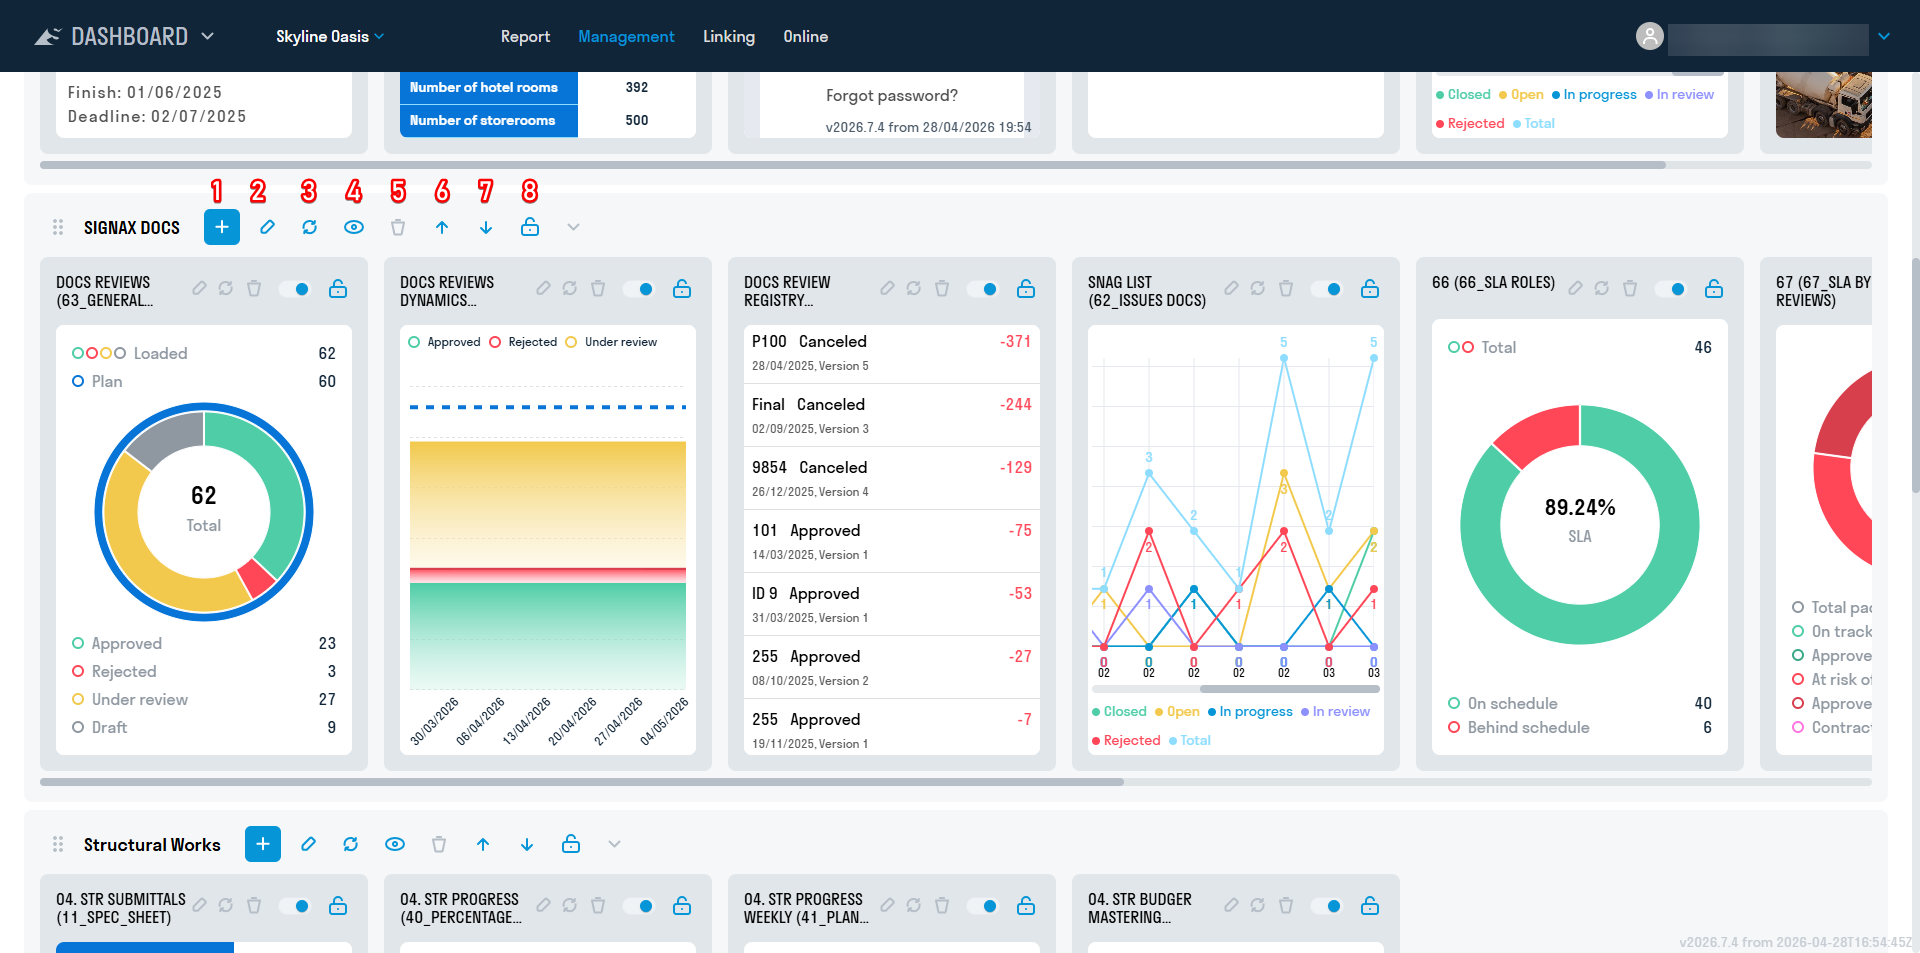
- Add a card
- Edit group
- Refresh cards data
- Hide group
- Delete group
- Move group up
- Move group down
- Deactivate group
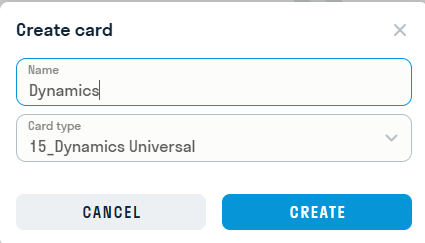
In the window that opens, select the card type from the list and enter a name for the card. Then click “Save”. Each card is described in detail in the instructions.
Editing a card:
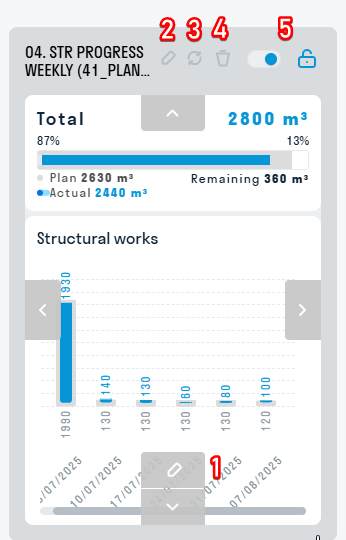
- Edit card settings
- Rename card
- Refresh card
- Delete card
- Hide/Deactivate card
- Arrows - move card
Report creation is performed in the “Management” section.
To create the next report for the new week/month, select an existing report to base the new one on. Then expand the date list and click "Add Report".
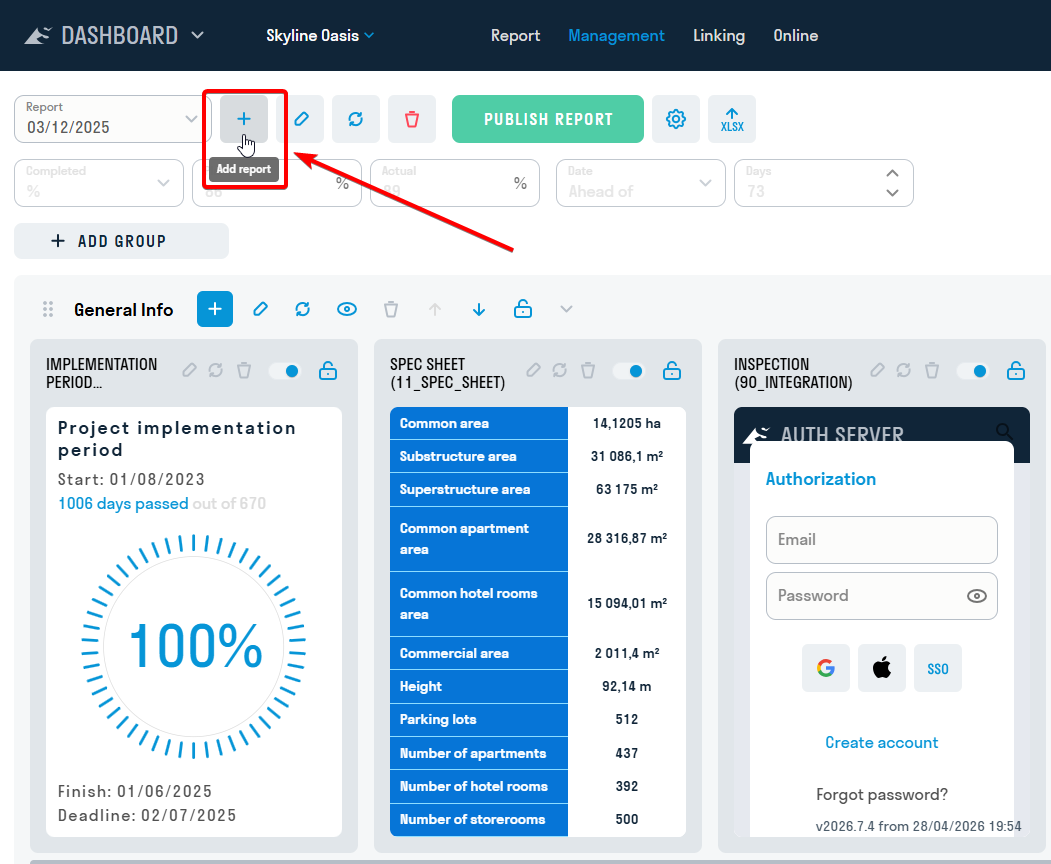
In the window that opens, enter the date for the report and click "Create".
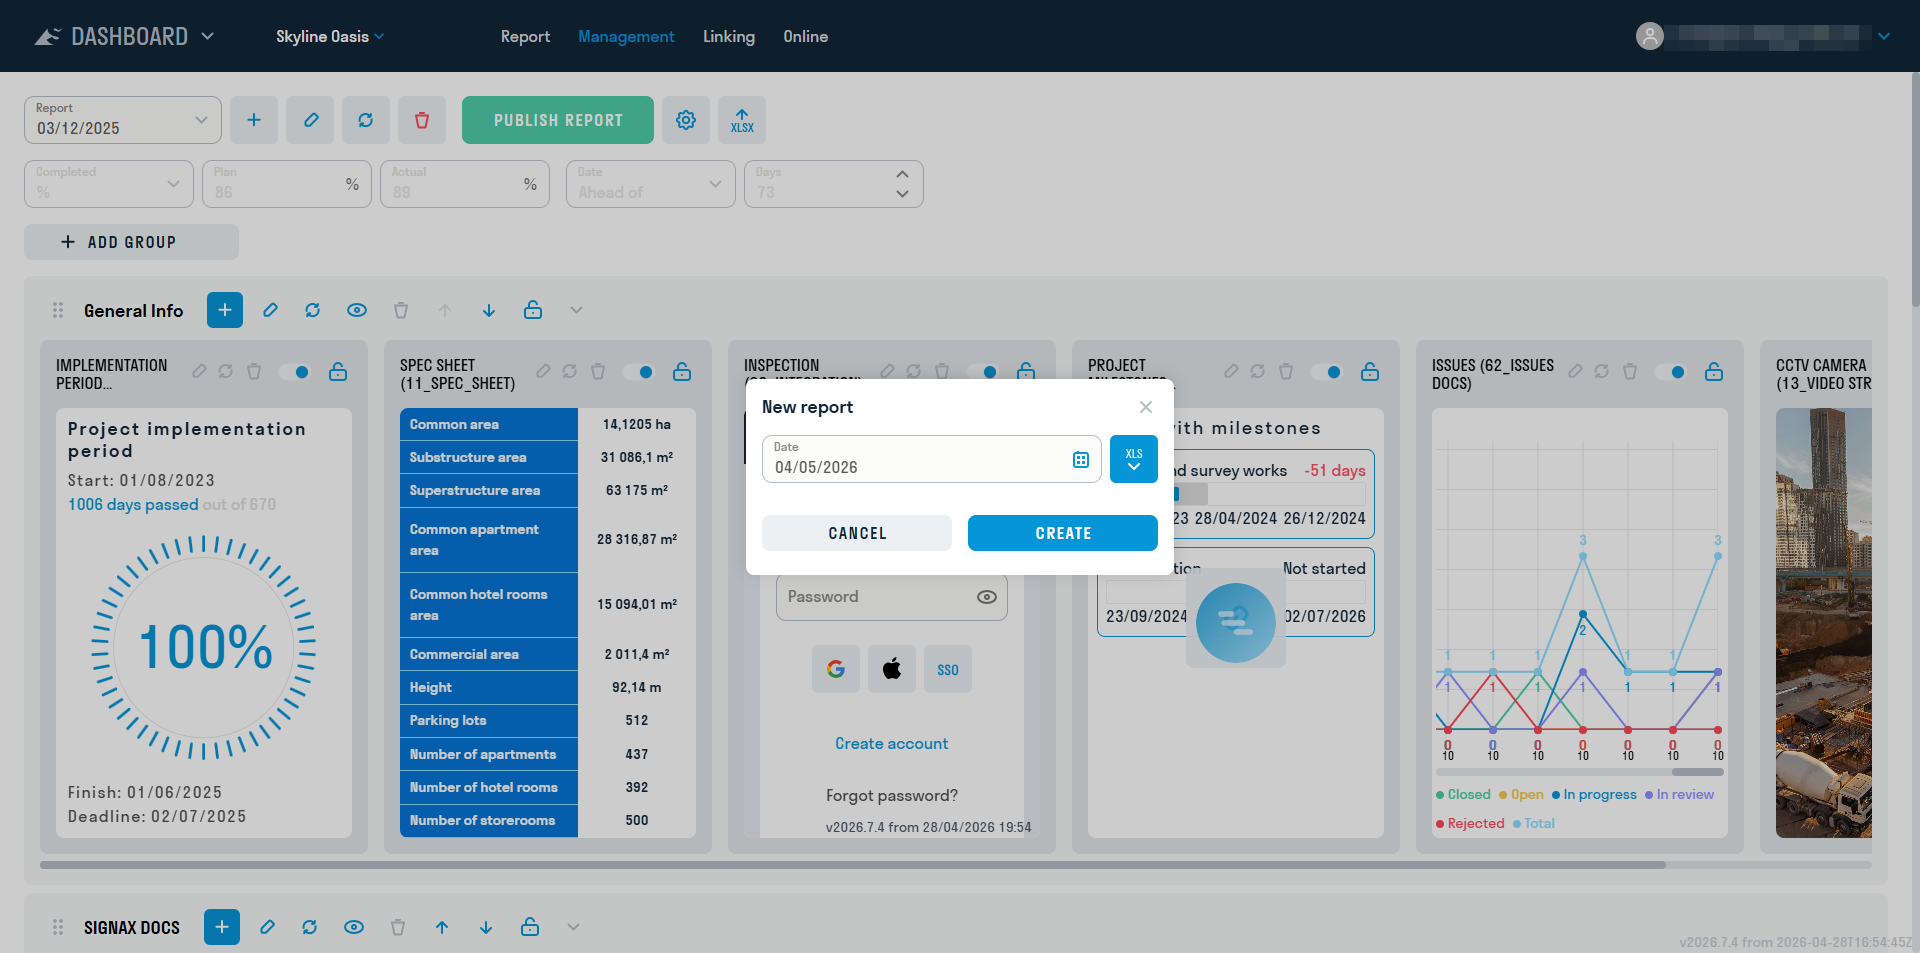
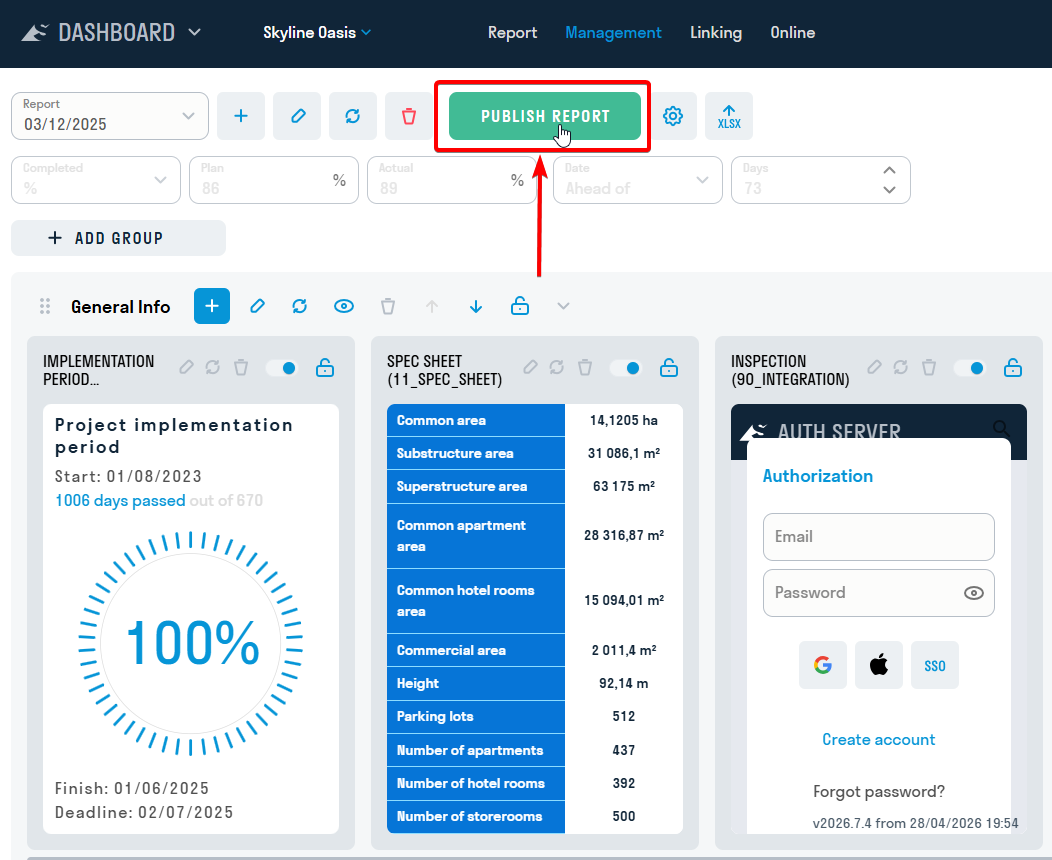
A report that has not yet been published is not available for viewing by users.
A report that has not yet been published is not available for viewing by users. To make a report available to users, you must publish it in the "Report" section. To do this, click "Publish Report". Previously published reports remain available to users in the "Report" section.
¶ 3. Updating report data
After creating a new report, you need to update the card data in accordance with the current information on the object.
You can update the data directly by editing the cards, or you can export the report to Excel or Google Sheets. After updating the information in Excel or Google Sheets, they can be imported back into the DASHBOARD service.
¶ Linking cards via Google Sheets
The DASHBOARD service provides the ability to link cards to a Google Sheet. This allows you to speed up the process of adding/updating data in the created cards. Linking in Google Sheets is done through named ranges.
1. First, you need to create a Google Sheet. This can be done in two ways:
Method 1.
This method can be used to link a small number of selected cards, for example, the most frequently used ones in the project.
Directly create a new Google Table and share it. In the future, cards will be copied there.
[

Method 2.
This method can be used to link the entire report.
Download the entire report from the DASHBOARD service by clicking "Export to Excel".

Import Excel into a Google Sheet. To do this, in the new Google Table click "File" ➤ "Import". In the window that opens, go to the "Add" tab and upload the Excel file.

To make it easier to navigate the document after importing, you can change the sheet names in the Google Sheet to match the card names.

2. In the DASHBOARD service, go to the "Link" section. Copy the link to the Google spreadsheet and paste it into the "Link to Google spreadsheet" field. Then click

"Link report".

Note: When you create a new report, the link to the Google spreadsheet will be saved and transferred to the new report
3. Fill the Google Sheets report with the necessary cards, placing them on the same sheet as in Template or on different sheets. Click

to copy the card data to the clipboard. Go to Google Sheets and paste the data using Ctrl+V.

Note: When placing cards on one sheet, arrange them horizontally and do not insert a new card on top of an existing one.

4. Now you need to create ranges for the cards, adhering to the rule: one range can include only one card.
Open Named Ranges by clicking “Data” ➤ “Configure Named Ranges”.

- If the cards are located on a single sheet, select the range of columns that includes the card (for example, A, B, and C), enter the Range Name (for example, КС_2), and click “Done”. This will create a range from which the DASHBOARD service will pull card data. Repeat this operation with the remaining cards.

Note: The range name can only contain letters, numbers, and underscores (_) ; must not contain spaces or punctuation; and must not start with a number.
- If the cards are located on separate sheets, then select all the cells on the sheet by clicking on the intersection of columns and rows (hotkey Ctrl + A). Enter the Range Name, for example, КС_2, and click “Done”.

5. After adding the necessary cards to the Google spreadsheet and creating ranges, go back to the DASHBOARD service.
Click

"Refresh the list of ranges" to pull the created ranges from the Google spreadsheet.
Next, link the ranges to the cards. To do this, expand the range list on the card and select the range corresponding to the selected card. The card will then change color to dark blue.

6. After selecting the ranges, you need to sync the cards with the Google Sheet so they receive the updated data. To do this, click

on the card itself to sync data for one card, or at the top next to the Google Sheet link to sync the entire report.
