< DASHBOARD. Introduction | DASHBOARD. Cards 20. Money >
What's New
Major changes are listed here. Click on the version number for details.
Notations
 — new features
 — functionality improvements
 — error fixes
** 2025.27 ** 18.09.2025
Fixed a column editing error in card 15.
Information about earlier updates is available in the closed Telegam channel for SIGNAX users. To add ** Contact support **.
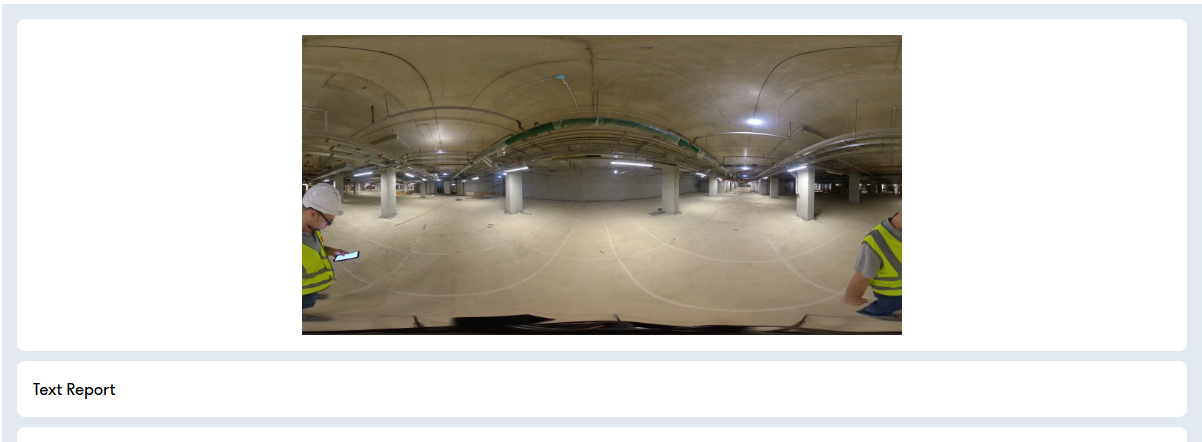
10_Album - the card is a photo album where you can upload several photos. For example, this could be a photo report from a construction site or photos for geo-marketing or advertising.
Displaying the card in user mode

¶ Setting up

- Adding new images.
- Selecting the main image for the preview.
- Cropping the image.
- Deleting the image.
¶ Using
The card displays the uploaded photos, which can be scrolled through.
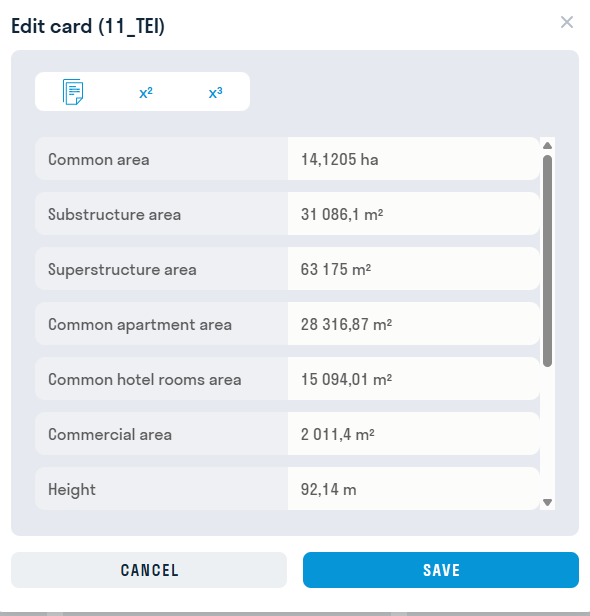
11_TEI - technical and economic indicators. Excel template
Displaying the card in user mode.

¶ Setting
The administrator enters the required values in the lines in edit mode.
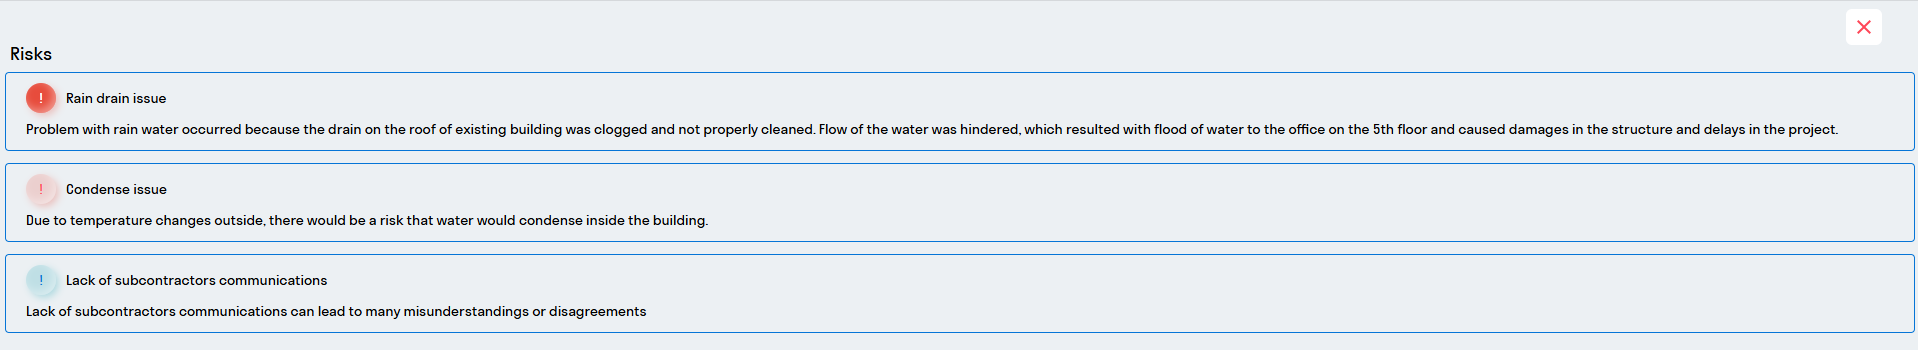
12.Risks - the card reflects information with the degree of importance about all possible risks associated with the object.
Displaying a card in user mode
In report viewing mode:

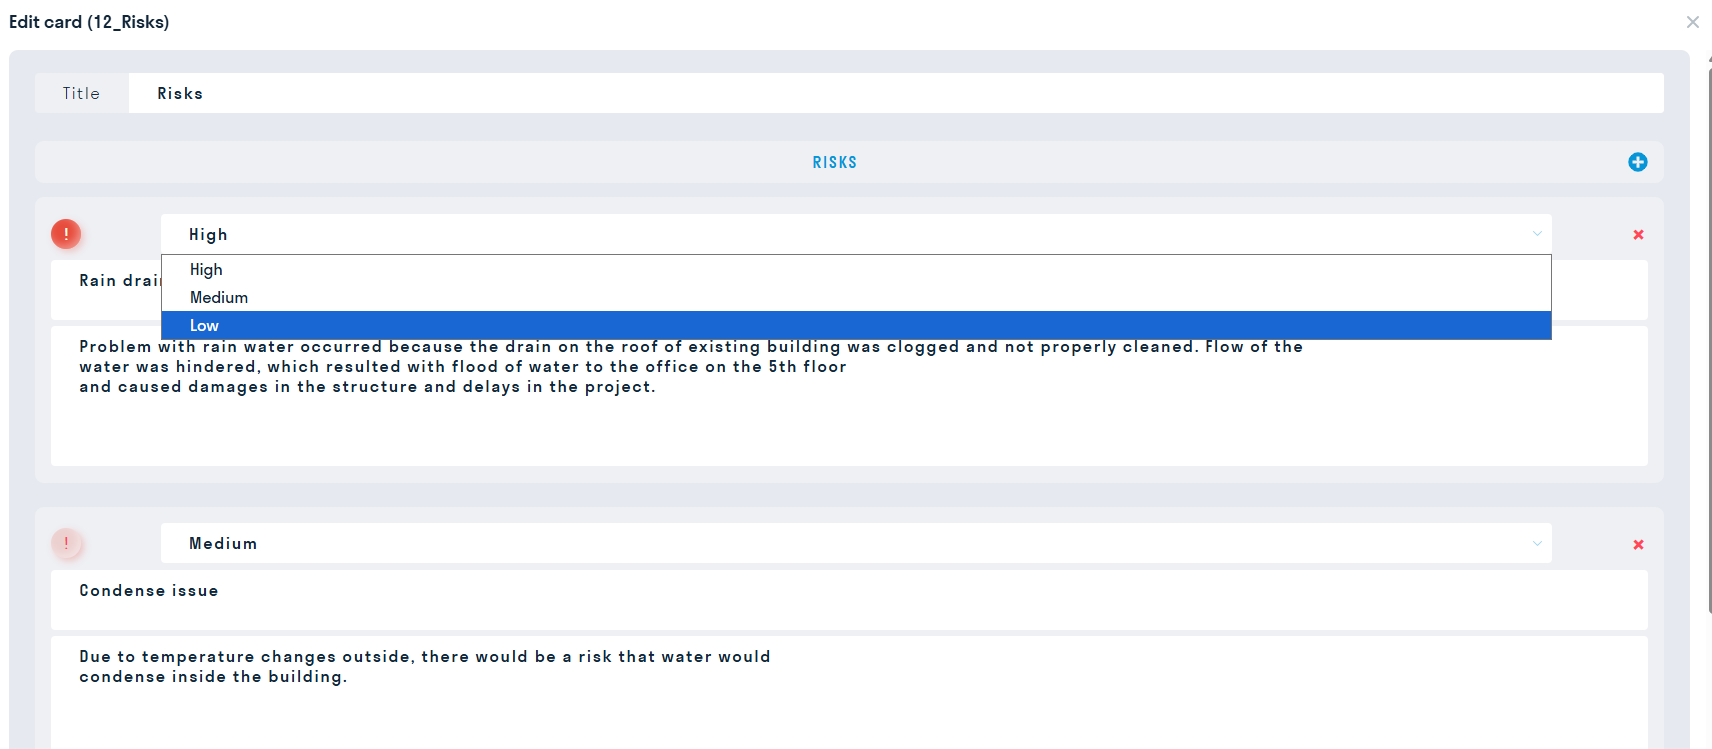
When opening a card:
¶ Setting up a card
- Basic settings
- In the “Title” line, enter the name - the heading.
- Set the level of significance for each line of the information message: Low, Medium, High.
- Leave the necessary comment.
- To add a new information message, press “+”.
13_Video stream - allows you to monitor production processes at the construction site in real time.
Displaying the card in user mode

¶ Setting up
1. RTSP Tab
Enter the link to the video broadcast in RTSP format

- In the “Title” line enter the name of the video broadcast.
- In the “HD STREAM” line insert the link to the video broadcast in RTSP format for high-quality broadcast.
- In the “SD STREAM” line insert the link to the video broadcast in RTSP format for low-quality broadcast.
- The “Show broadcast” switch allows you to choose which tab to display the broadcast from in the card: from RTSP or RTSP.ME.
2. RTSP.ME Tab
If your video broadcast is on the RTSP.ME website, then provide a link from this website in the RTSP.ME format

- In the “Title” line enter the name of the video broadcast.
- In the “STREAM” line paste the link to the video broadcast in RTSP.ME format.
- In the “Preview” line put an image for the preview card.
- The “Show broadcast” switch allows you to choose which tab to display the broadcast in the card: from RTSP or RTSP.ME.
¶ Using
When viewing a card in user mode, you can switch between two video broadcast qualities:
- HD viewing mode (high quality format).
- When unchecked, the viewing quality becomes low.


14_Workers trend - graph of the planned and actual number of workers by day. Excel template .
Displaying a card in user mode
In report viewing mode:

When opening a card:
¶ Setting up
1. Filling in manually
2. Updating data via Google Sheets
It is faster and more convenient to fill out a card via Google Sheets.
3. Copying data from the table
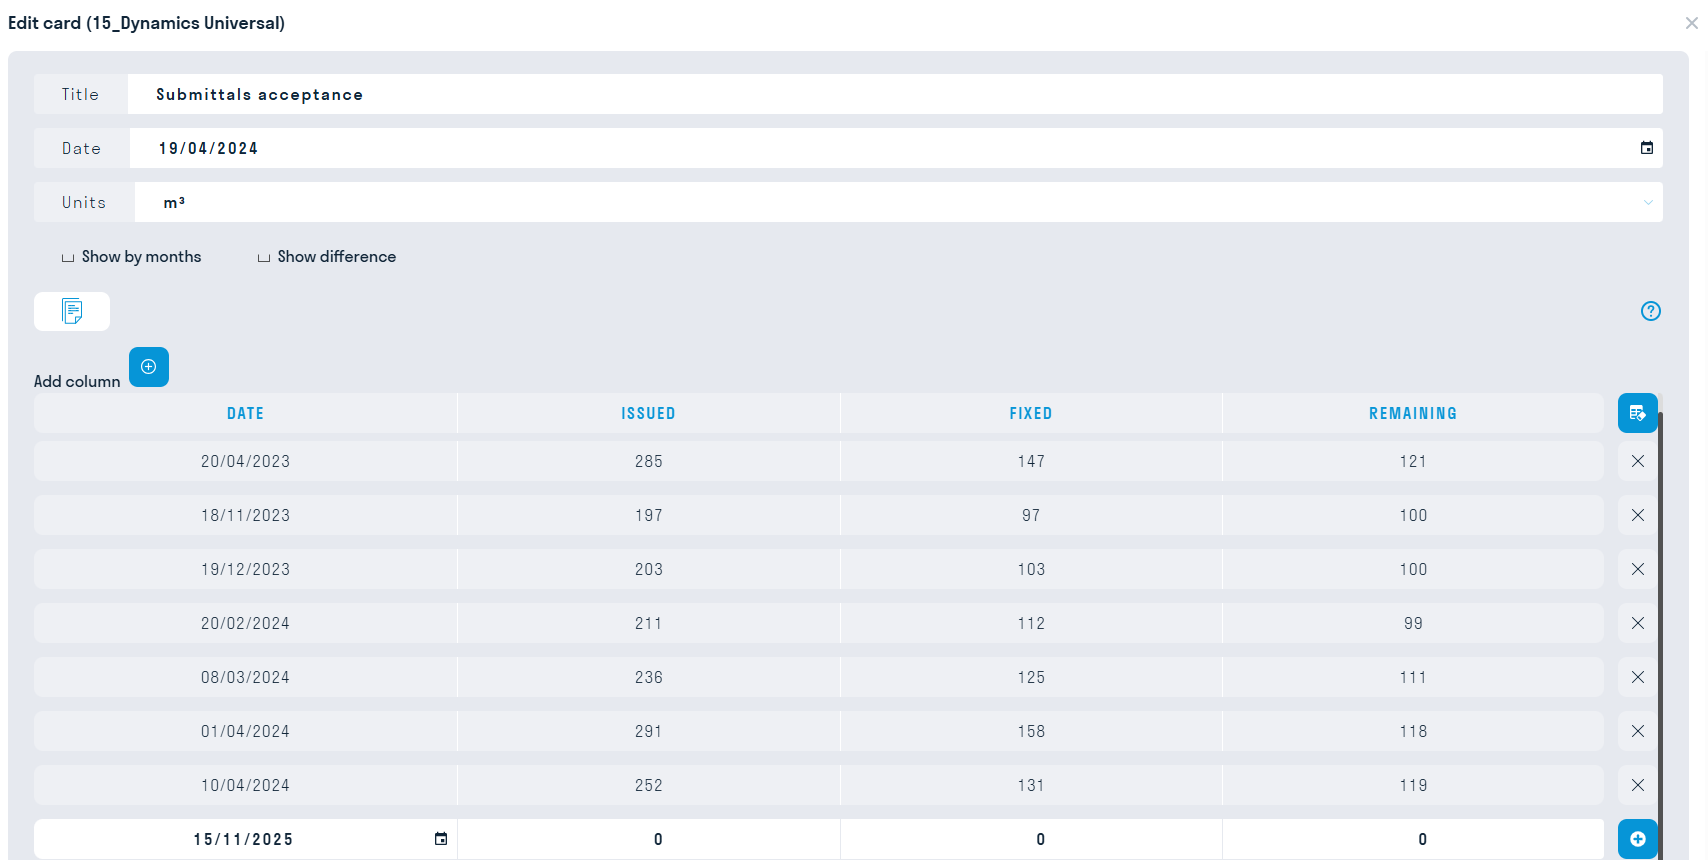
15_Dynamics Universal - the card displays the dynamics of any jobs. For example, you can show the amount of equipment on the construction site on a certain day, the number of signed or in-progress acts, etc.
Displaying the card in user mode
¶ Setting up
1. Filling out the card manually
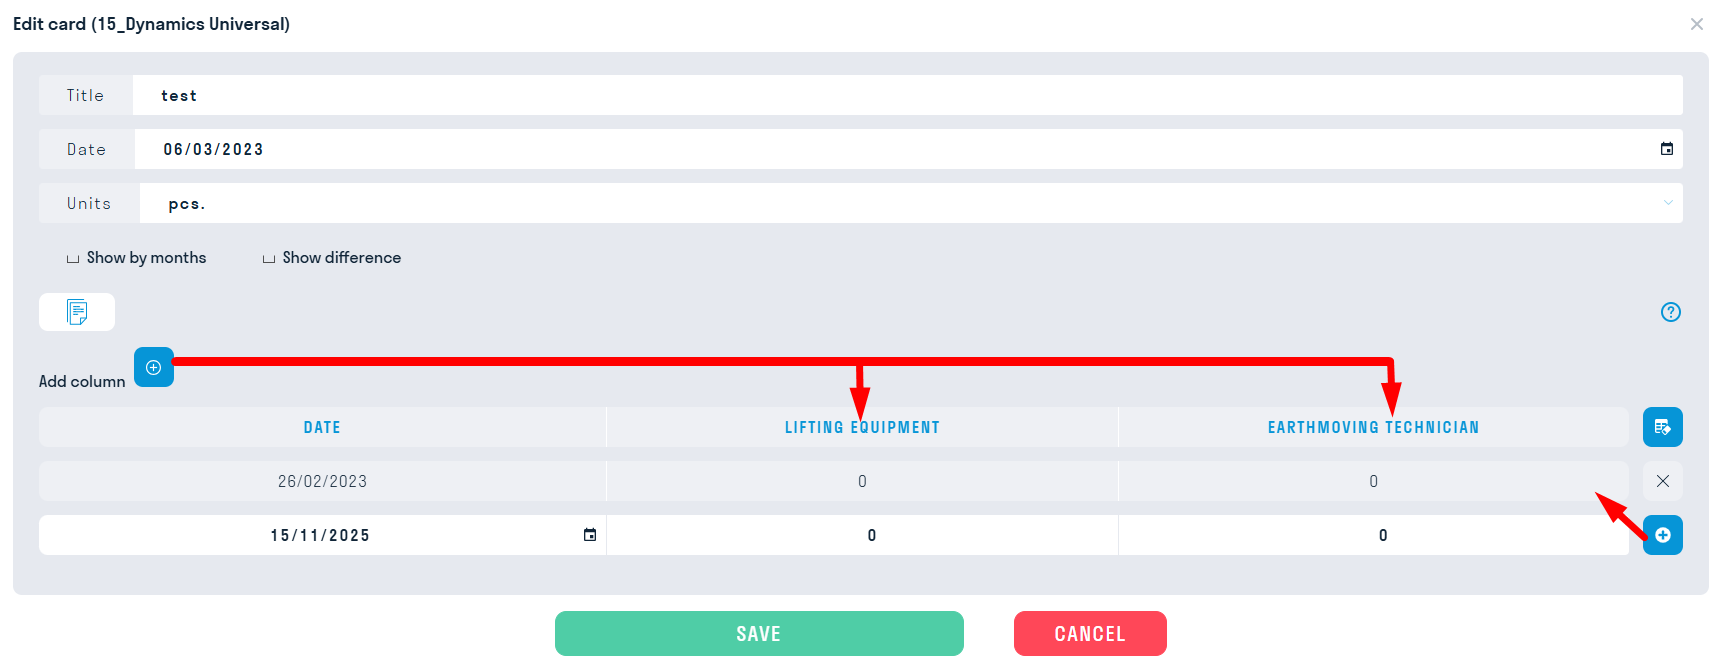
- Add the required number of columns by clicking the “Add column” button
- Add rows to the table by filling in the fields in the bottom row and clicking “+” to the right of it
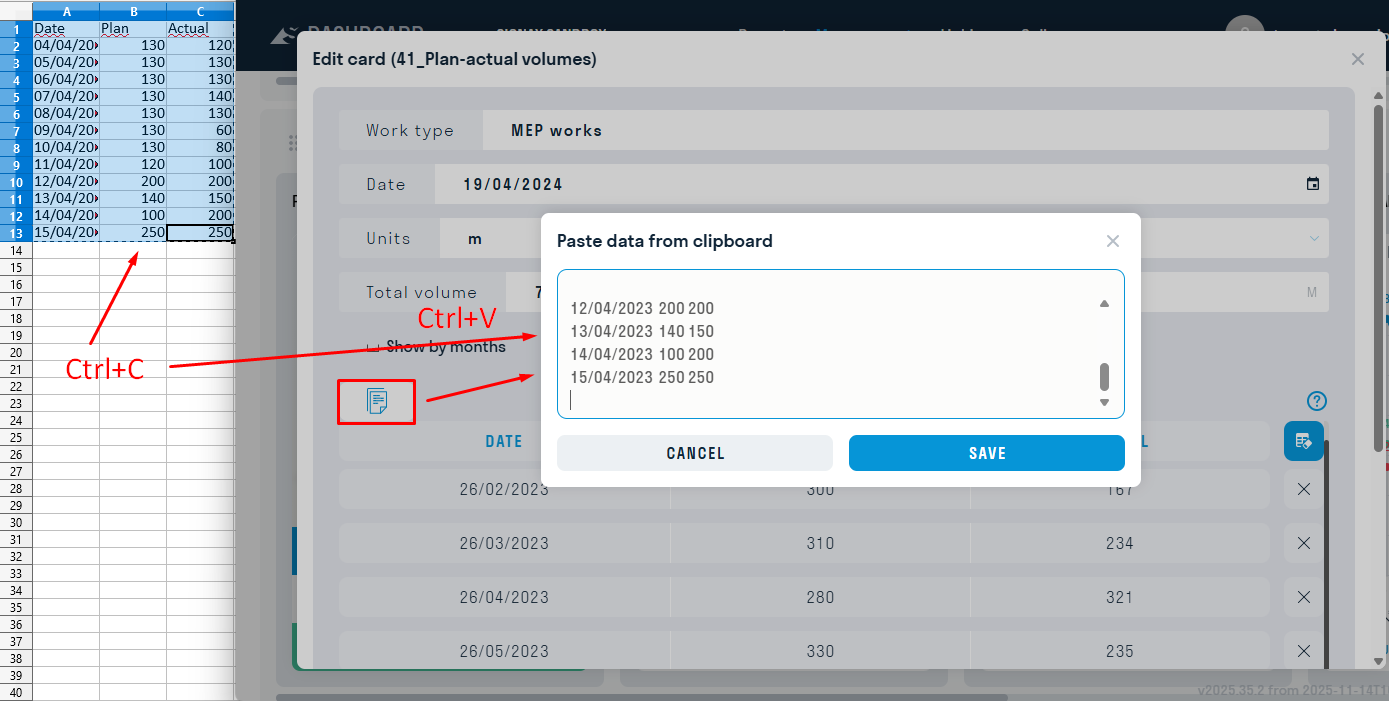
2. Filling out the card using Excel
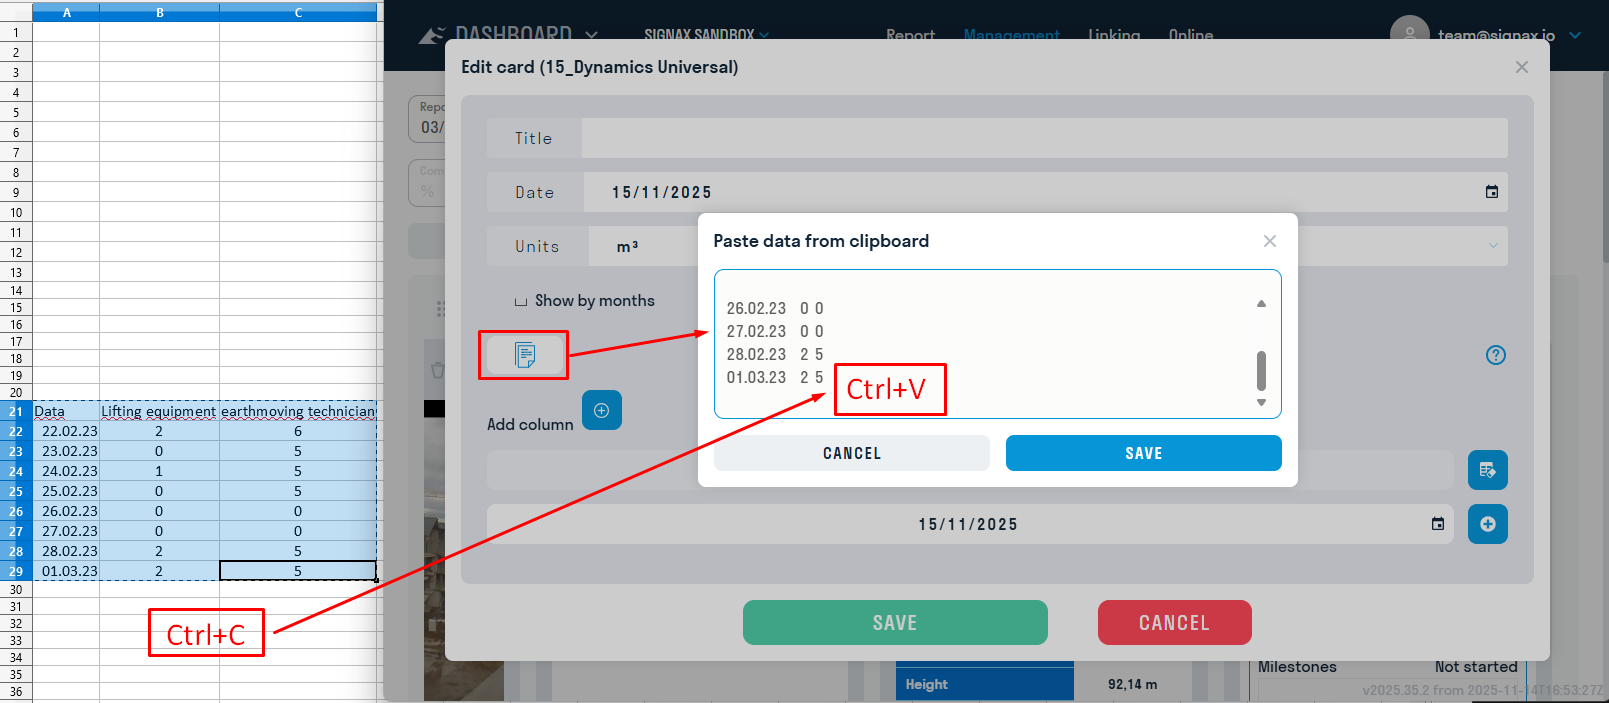
- Add the required number of columns by clicking the “Add Column” button
- Click the “Insert Data” button and copy the data from Excel into the card using the Ctrl+C and Ctrl+V key combination
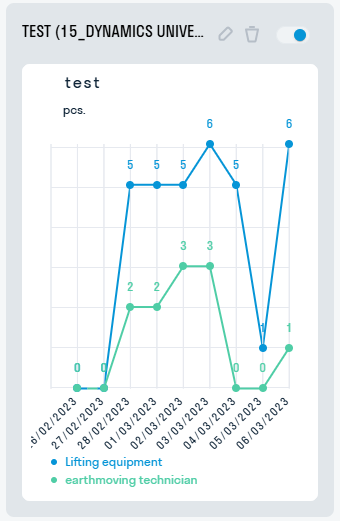
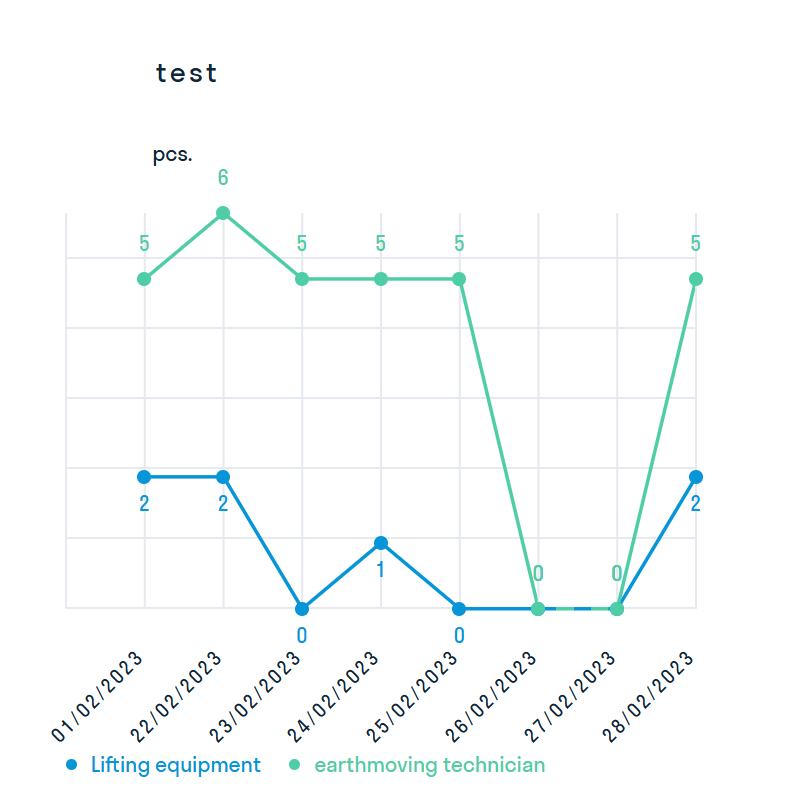
¶ Using
The card contains a graph displaying the entered information.
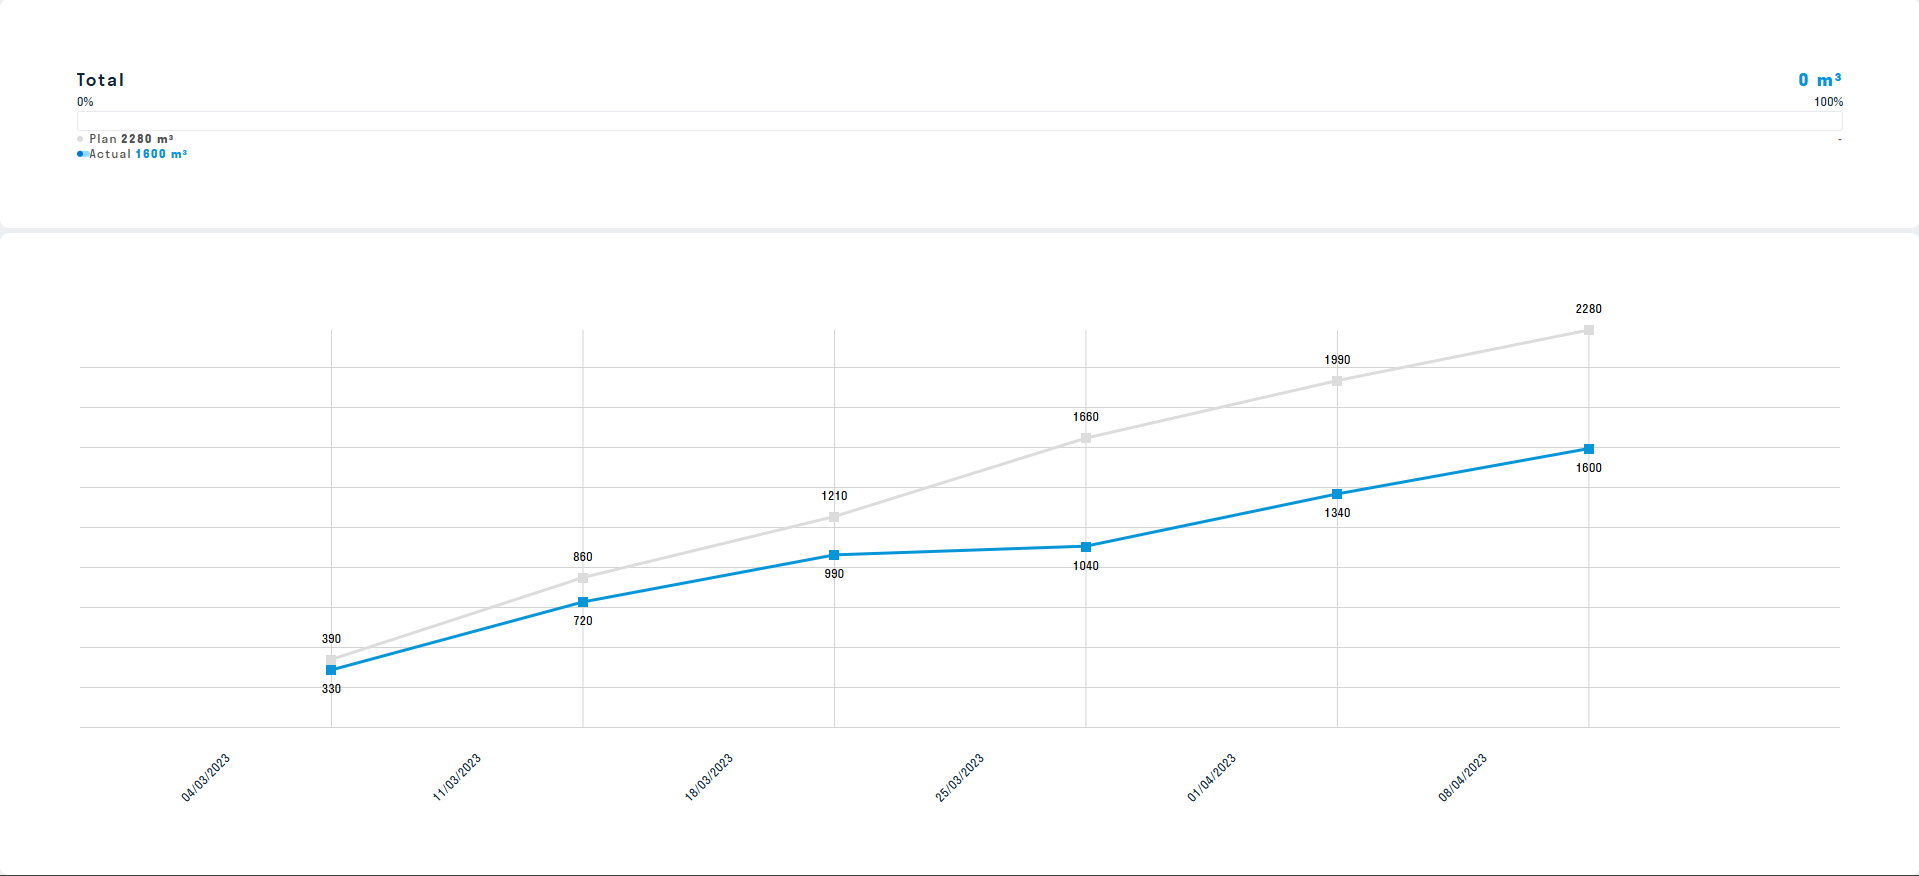
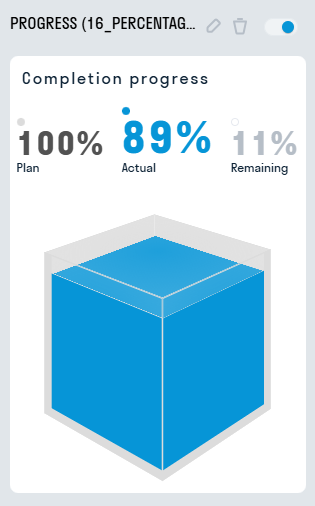
16_Percentage of object readiness - the card shows the degree of object completion as a percentage: plan/actual/remaining. For example, you can visualize the overall completion percentage for the entire object or the completion percentage for a specific type of work.
Displaying the card in user mode

- Entire cube - entire volume (100%)
- Blue body - actual volume
- Gray body - planned volume
¶ Setting up
1. Basic settings
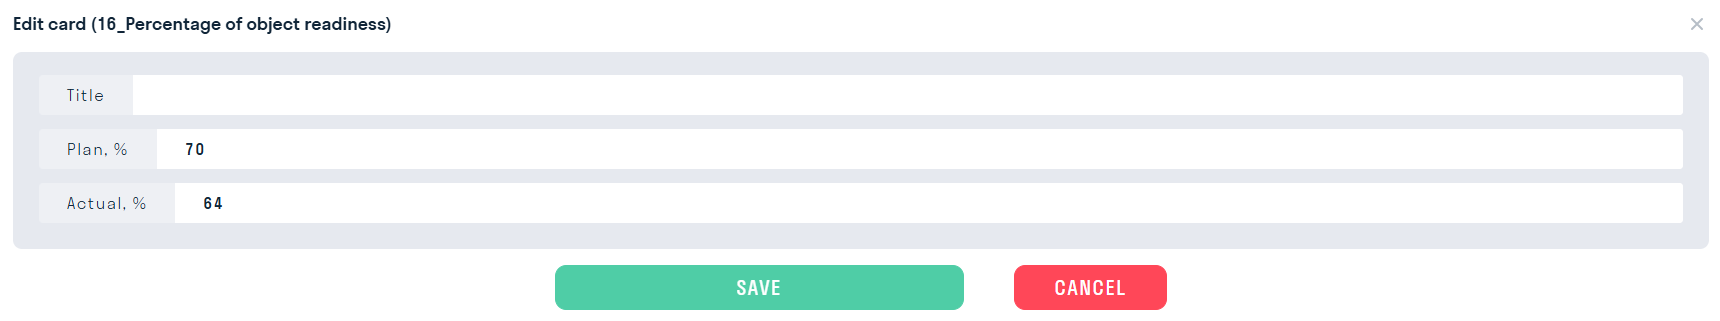
- In the “Name” line enter the name of the object or type of work for which you want to display the completion percentage.
- In the line “Plan” enter the planned percentage of completion.
- In the line “Actual” enter the actual percentage of completion.
Note: If the actual is ahead of the plan, the excess of actual readiness over the planned is highlighted in blue
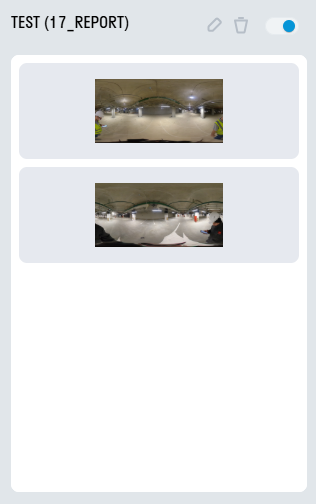
17_Report - a card for displaying reporting graphical and text information.
Displaying a card in user mode
¶ Setting
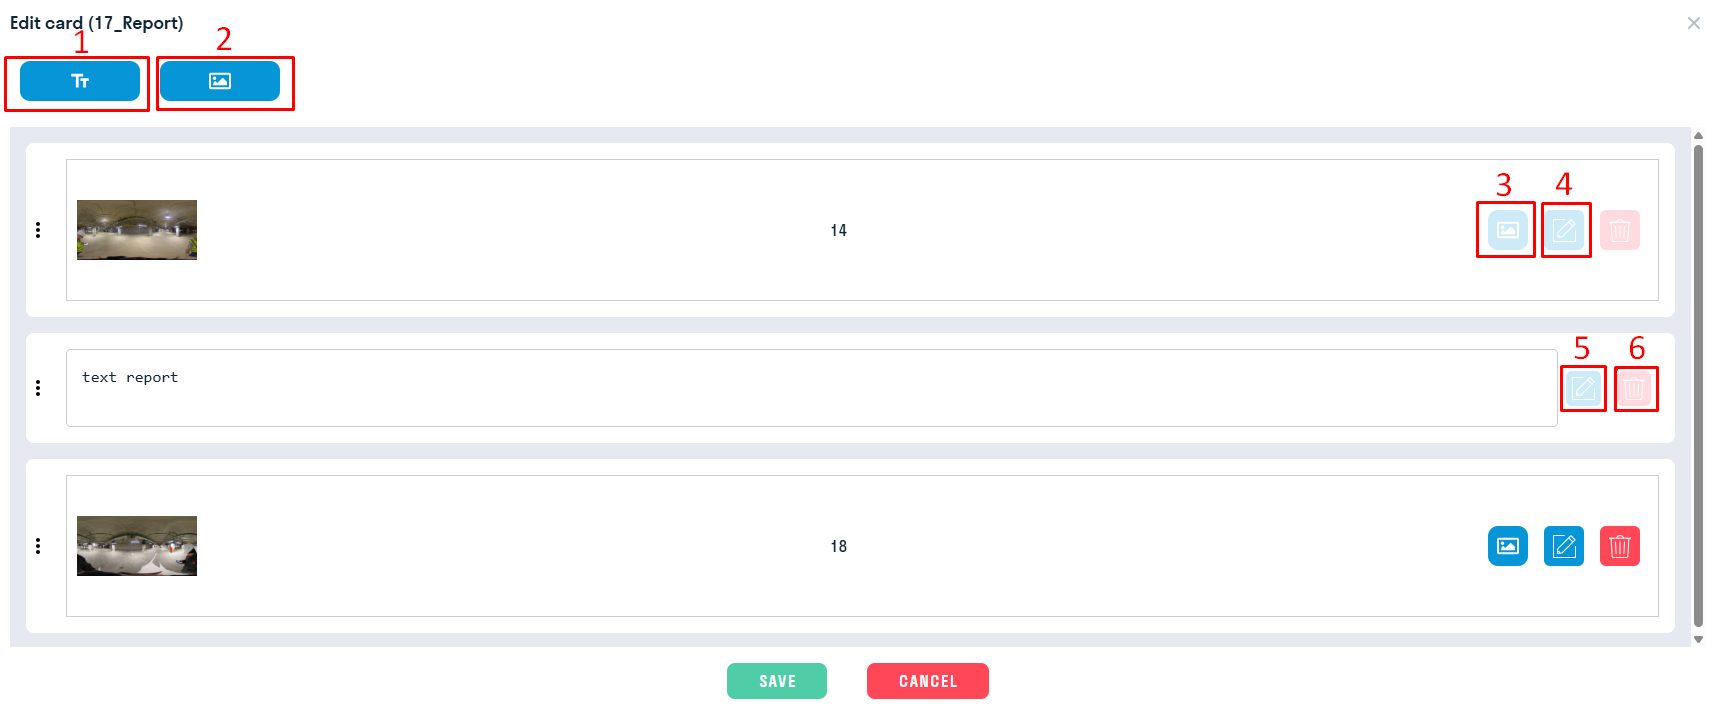
- Add a window with text information.
- Add a window with graphic information.
- Change the image.
- Crop the image.
- Edit the text.
- Remove a window with text or graphic information.
¶ Using
Inside the card there is a generated report with text and graphic information