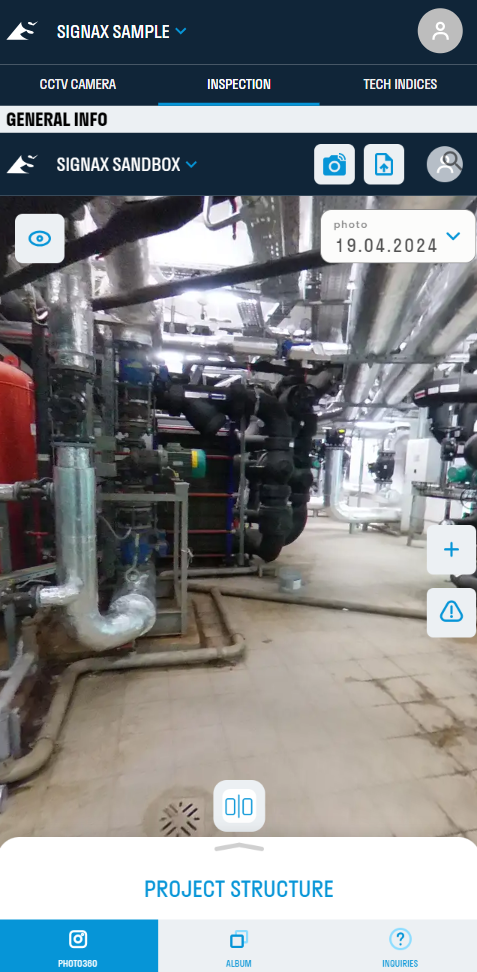
3.2 DASHBOARD
The key advantages of SIGNAX DASHBOARD are: - Always up-to-date data in the smartphone - Clear understanding of the situation on the construction site - Unified reporting standard for all projects - Transparent management, clear metrics Please check our predefined reporting cards:
- Construction progress tracking methodology
- DASHBOARD - How to create reports
- 10_Album
- 11_TEI
- 12_Risks
- 13_Video stream
- 14_Workers trend
- 15_Dynamics universal
- 16_Percentage of object readiness
- 20_Percentage of money spent
- 21_General cumulative by money
- 22_Mastering money by month
- 30_Percentage of implementation period
- 31_Project milestones
- 32_Graph excel
- 33_Graph MPP
- 34_Graph MPP with milestones
- 35_Chart
- 36_Chart
- 41_Plan-Actual volumes
- 43_Execution rates by volume
- 45_Forecast
- 52_Summary BIM model
- 54_BIM model by color
- 55_BIM planned volumes
- 56_BIM actual volumes
- 62_Issues DOCS
- 63_General reviews in DOCS
- 64_Dynamics of reviews DOCS
- 65_Register of Reviews DOCS
- 66_Folders
- 71_Activity chart ACC
- 90_Integration
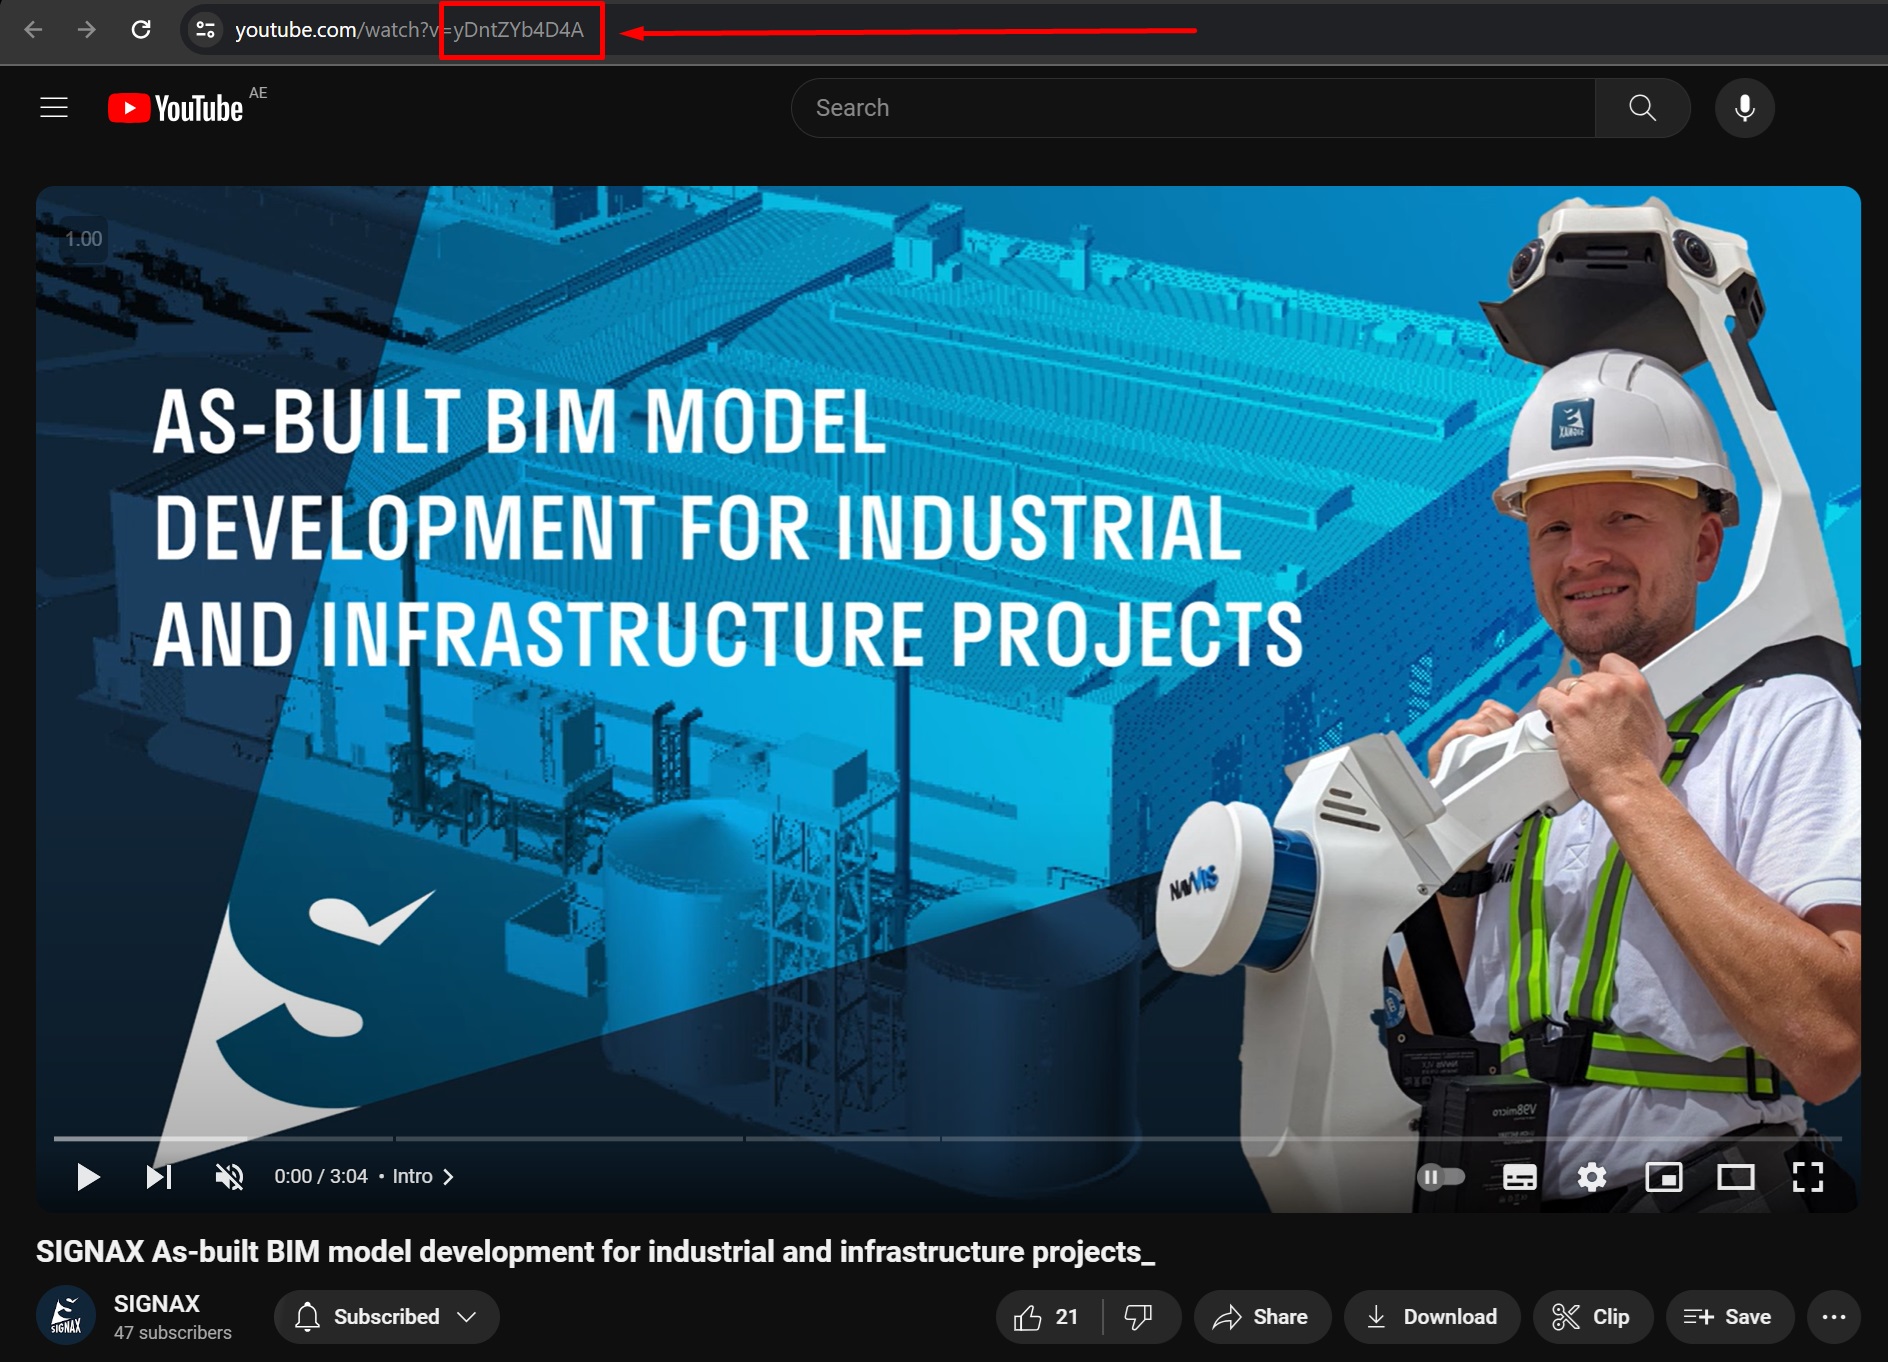
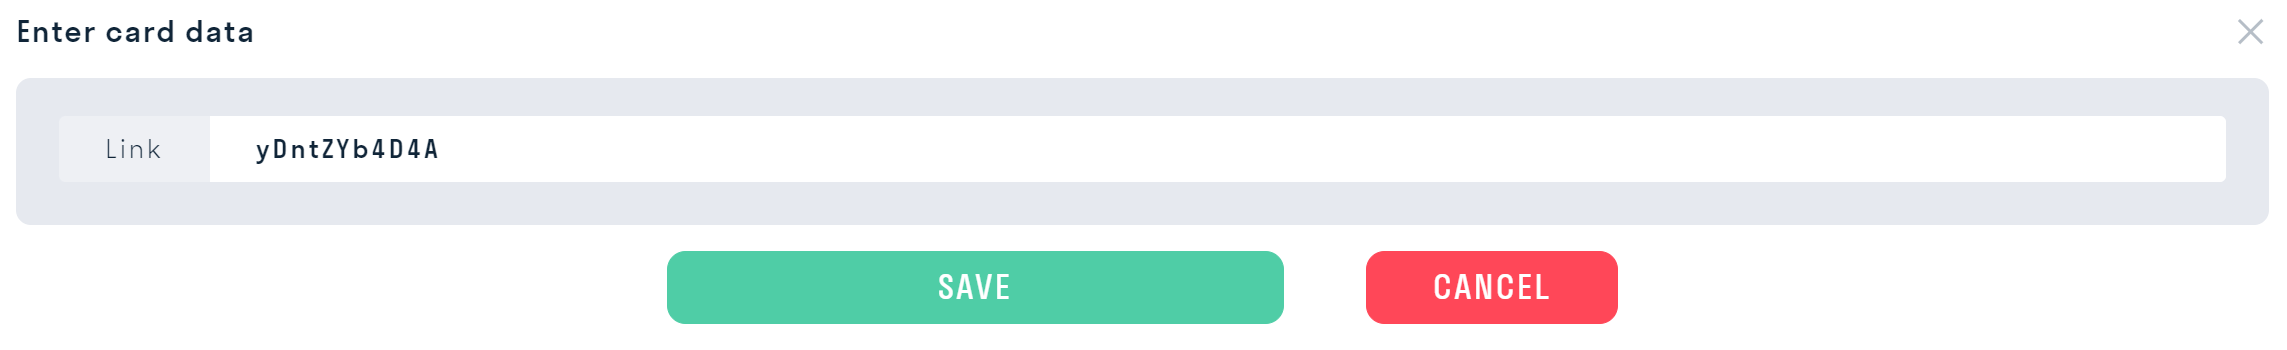
- 92_YouTube Link
Construction progress tracking methodology
DASHBOARD - How to create reports
Access DASHBOARD
Viewing reports with cards is done through a web browser on a PC and from a mobile device at dash.signax.io. To access the user account dashboard, you will need a SIGNAX account with a DASHBOARD license.
Download the mobile application for iOS or Android devices: dm.signax.io
Login to DASHBOARD

Select the Company and open the Project from the list available to the user. For each project, brief information about its status is displayed, which is configured by the Project Administrator.

The user has access to the "Report" section, where published reports with cards for the selected date are displayed. Some cards can be opened, while others only show information in the preview. You can familiarize yourself with the purpose of all cards in the "Instructions".

DASHBOARD Admin
Access to the User Account
Creating and editing report cards is done at dash.signax.io in the "Management" section. To access the user account dashboard, you will need a SIGNAX account with a DASHBOARD license.
Adding users to projects and adjusting access rights to view specific projects is done using the SIGNAX HUB admin panel.
Logging into the user account is no different from the user's. In addition to the "Report" section, the Administrator has access to the "Management" and "Linking" sections for creating and configuring cards.
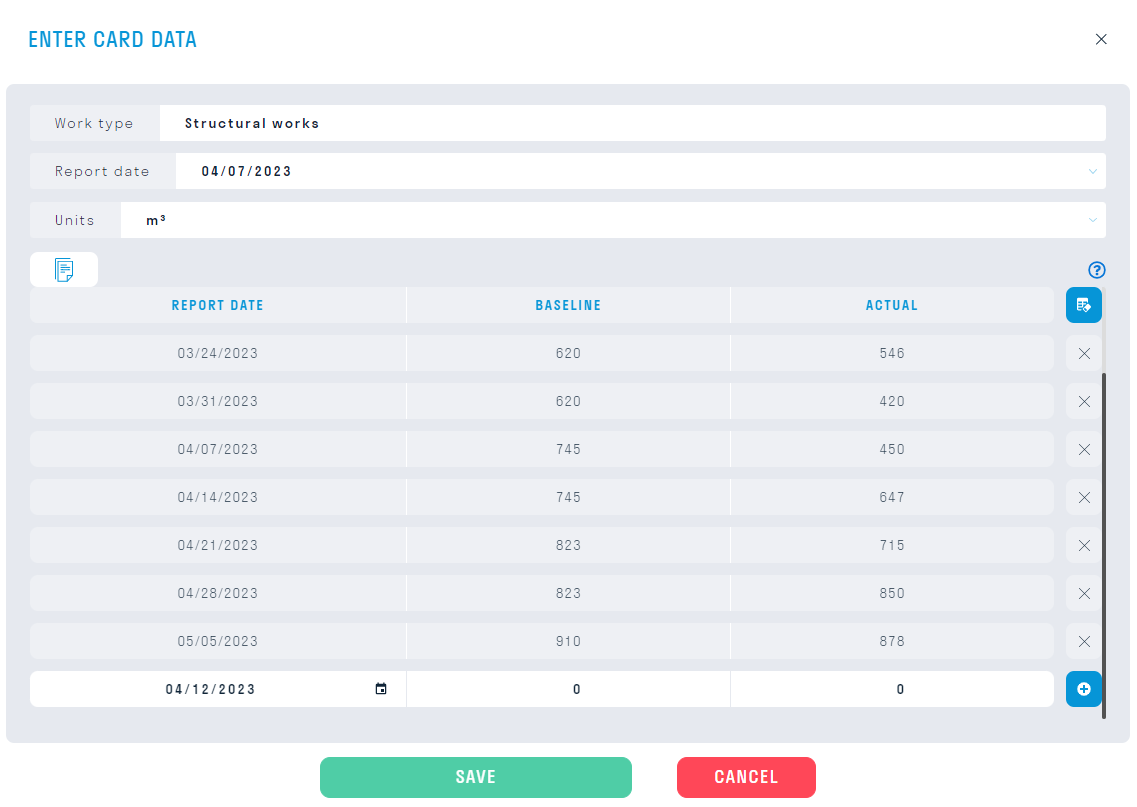
When opening a new project for the first time, you will be prompted to create a report - enter the report date and click "Save".

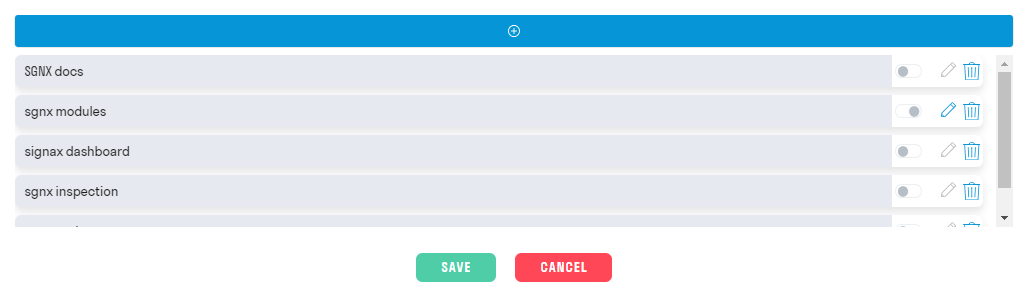
Adding Cards and Groups
Adding and editing cards is done in the "Management" section.
First, you need to create a group. With groups, you can divide cards into different construction sections, locations, etc., for easy navigation through the report.
To create a group, enter its name, for example, GENERAL DATA, and click "+".

Editing a group:

- Rename the group
- Hide/Show the group in the "Report" section
- Delete the group
- Move the group down
- Move the group up
To create a card, click "+" inside the group.

In the opened window, select the card type from the list and enter the card name. Then click "Save". Each card is described in detail in the instructions.
Editing a card:

- Rename the card
- Hide/Show the card in the "Report" section
- Delete the card
Creating a Report
Creating a report is done in the "Management" section.
To create the next report for a new week/month, select the existing report, based on which the new one will be created. Then expand the list of dates and click "New Report".

In the opened window, enter the date for the report and click "Save".

Publish reports
An unpublished report is not accessible for users to view. To make the report available to users, it needs to be published in the "Report" section. To do this, click "Publish Report". Previously published reports remain available to users in the "Report" section.

Updating Report Data
After creating a new report, it is necessary to update the data for the cards according to the current information about the object.
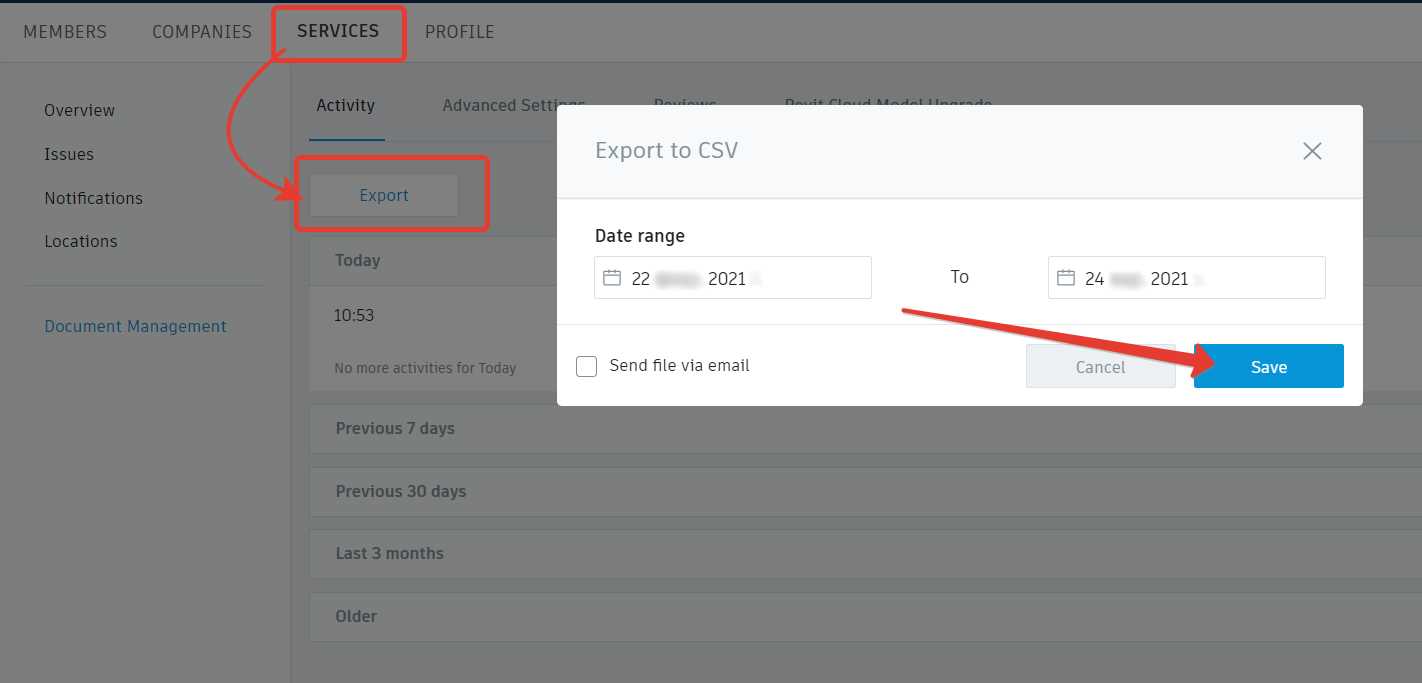
Data updates can be performed directly by editing the cards or by exporting the report to Excel or Google Sheets. After updating the information in Excel or Google Sheets, they can be imported back into the DASHBOARD service.
Linking Cards via Google Sheets
The DASHBOARD service offers the option to bind cards to a Google Sheet. This speeds up the process of adding/updating data in created cards. Linking in Google Sheets is done through named ranges.
-
First, create a Google Sheet. This can be done in two ways:
Method 1:
This method can be used to bind a small number of selected cards, for example, the most commonly used ones in the project.
Simply create a new Google Sheet or a copy of the template and grant access to it. Cards will be copied there in the future.

Method 2:
This method can be used to bind the entire report.
Download the entire report from the DASHBOARD service by clicking "Export to Excel".

Import the Excel file into Google Sheets. To do this, in a new Google Sheet, click "File" ➤ "Import". In the opened window, switch to the "Upload" tab and upload the Excel file.

To navigate the document more easily after importing it, you can rename the sheets in Google Sheets according to the names of the cards.

-
In the DASHBOARD service, go to the "Linking" section. Copy the link to the Google Sheet and paste it into the "Google Sheet Link" field. Then click
 "Link Report".


Note: When creating a new report, the link to the Google Sheet will be saved and transferred to the new report.
3. Populate the Google Sheet report with the necessary cards, placing them on the same sheet as in the template or on separate sheets. Click the  to copy the card data to the clipboard. Paste the data into Google Sheets using Ctrl+V.

Note: When placing cards on the same sheet, arrange them horizontally and do not insert a new card on top of an existing one.
4. Now you need to create ranges for the cards, adhering to the rule: only one card can be included in one range.
Open Named Ranges by clicking "Data" ➤ "Named Ranges".

- If the cards are placed on the same sheet, select the range of columns that includes the card (for example, A, B, and C), enter the Range Name (for example, Plan_Actual), and click "Done". A range will be created from which the DASHBOARD service will pull the data for the cards. Repeat this process for the remaining cards.

Note: The range name can only contain letters, numbers, and underscores (_); it should not contain spaces or punctuation marks; it should not start with a number.
- If the cards are placed on separate sheets, select all cells on the sheet by clicking on the intersection of columns and rows (hotkey Ctrl+A). Enter the Range Name, for example, Plan_Actual, and click "Done".
5. After adding the necessary cards to the Google Sheet and creating the ranges, return to the DASHBOARD service.
Click the  to "Refresh the list of ranges" to pull the created ranges from the Google Sheet. Then bind the ranges to the cards. To do this, on the card, expand the list of ranges and select the range corresponding to the selected card. After that, the card will change color to dark blue.

6. After selecting the ranges, you need to synchronize the cards with the Google Sheet to update their data. To do this, click  on the card itself to synchronize the data of one card, or above the link to the Google Sheet, to synchronize the entire report.

10_Album
10_Album - Add photos or any images about your project. You can use any uploaded image as the Album Cover.

- add picture;
- choose the album cover;
- crop the picture and add background;
- delete.
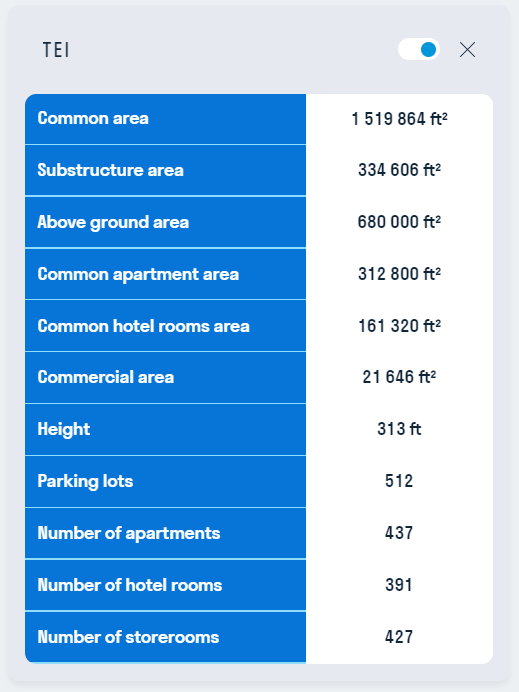
11_TEI
12_Risks
12_Risks - slide with information about all possible risks

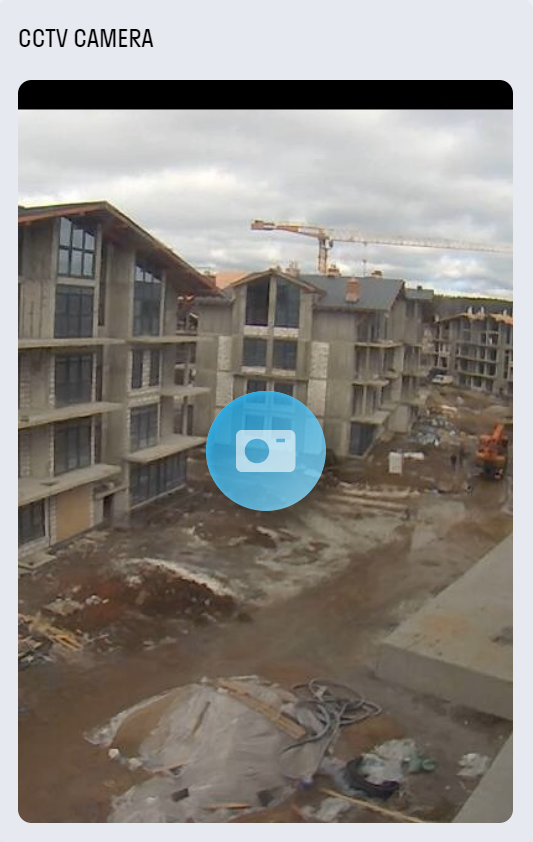
13_Video stream
13_Video Stream - allows tracking production processes on the construction site in real-time.
Displaying the Card in User Mode
Card Configuration
- RTSP Tab
Specify the link to the video stream in RTSP format.
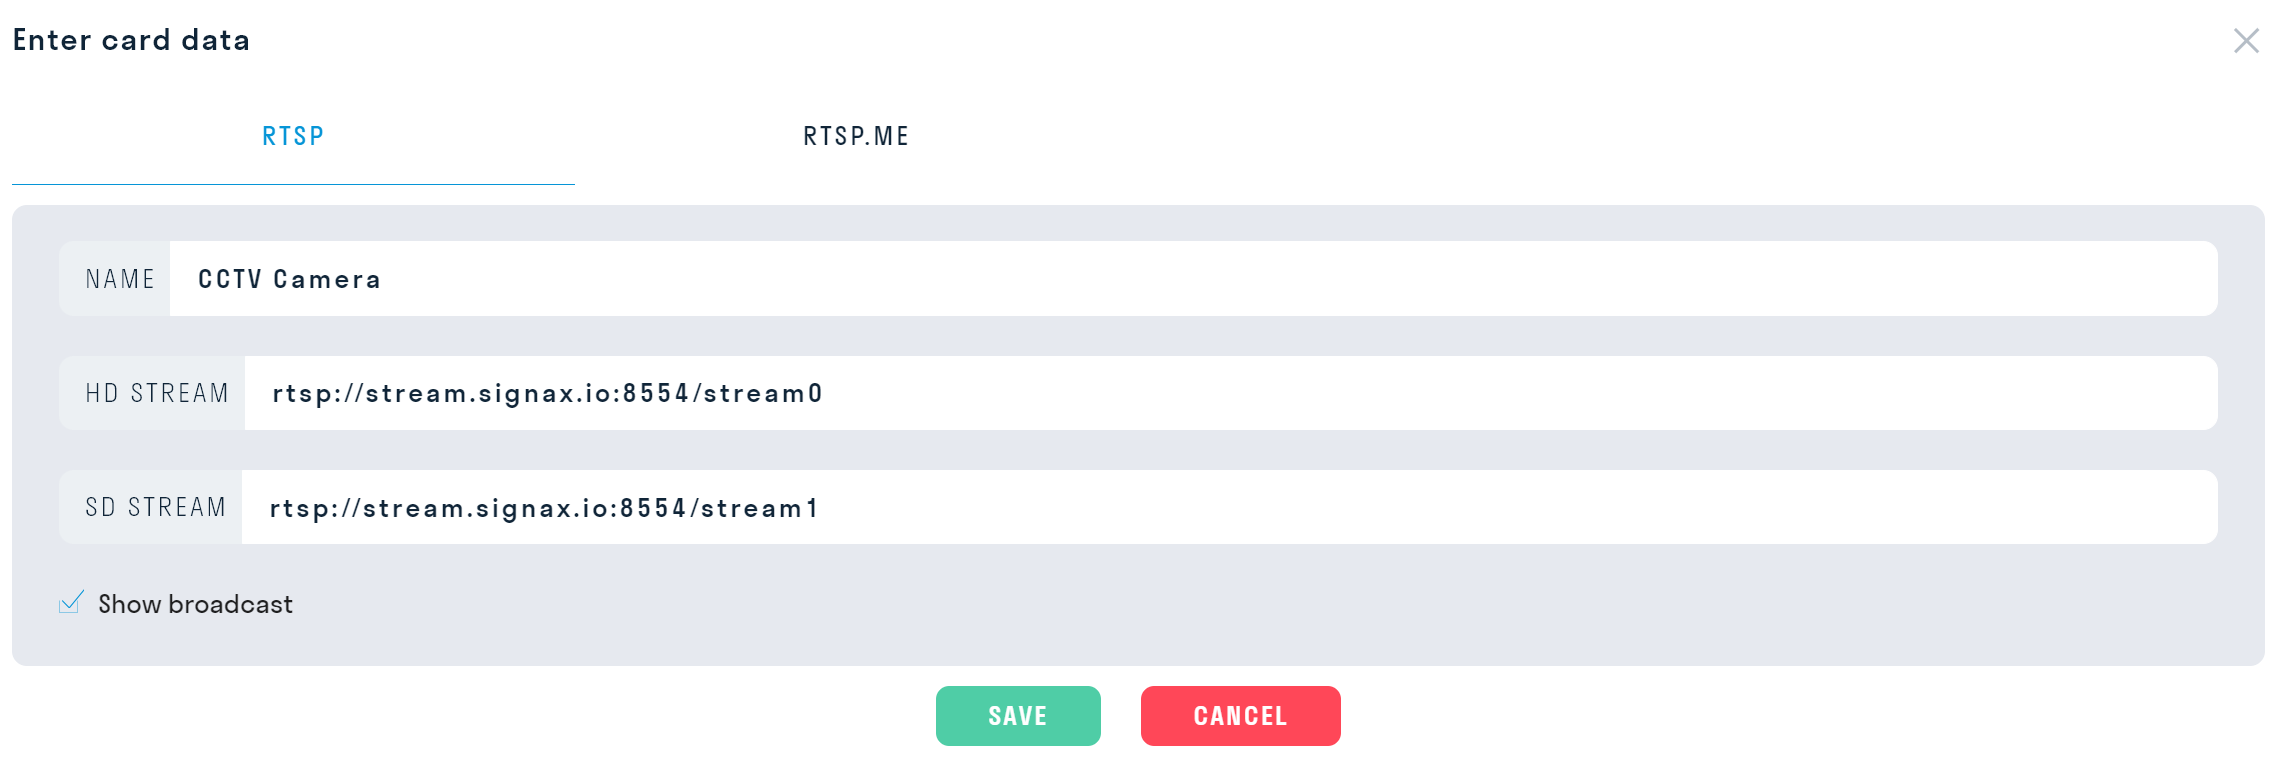
- In the "Name" field, enter the name of the video stream.
- In the "HD Stream" field, insert the link to the video stream in RTSP format for high-quality streaming.
- In the "SD Stream" field, insert the link to the video stream in RTSP format for low-quality streaming.
- The "Display Stream" switch allows selecting from which tab to display the stream in the card: from RTSP or RTSP.ME.
- RTSP.ME Tab
If your video stream is hosted on the RTSP.ME website, specify the link from this site in RTSP.ME format.
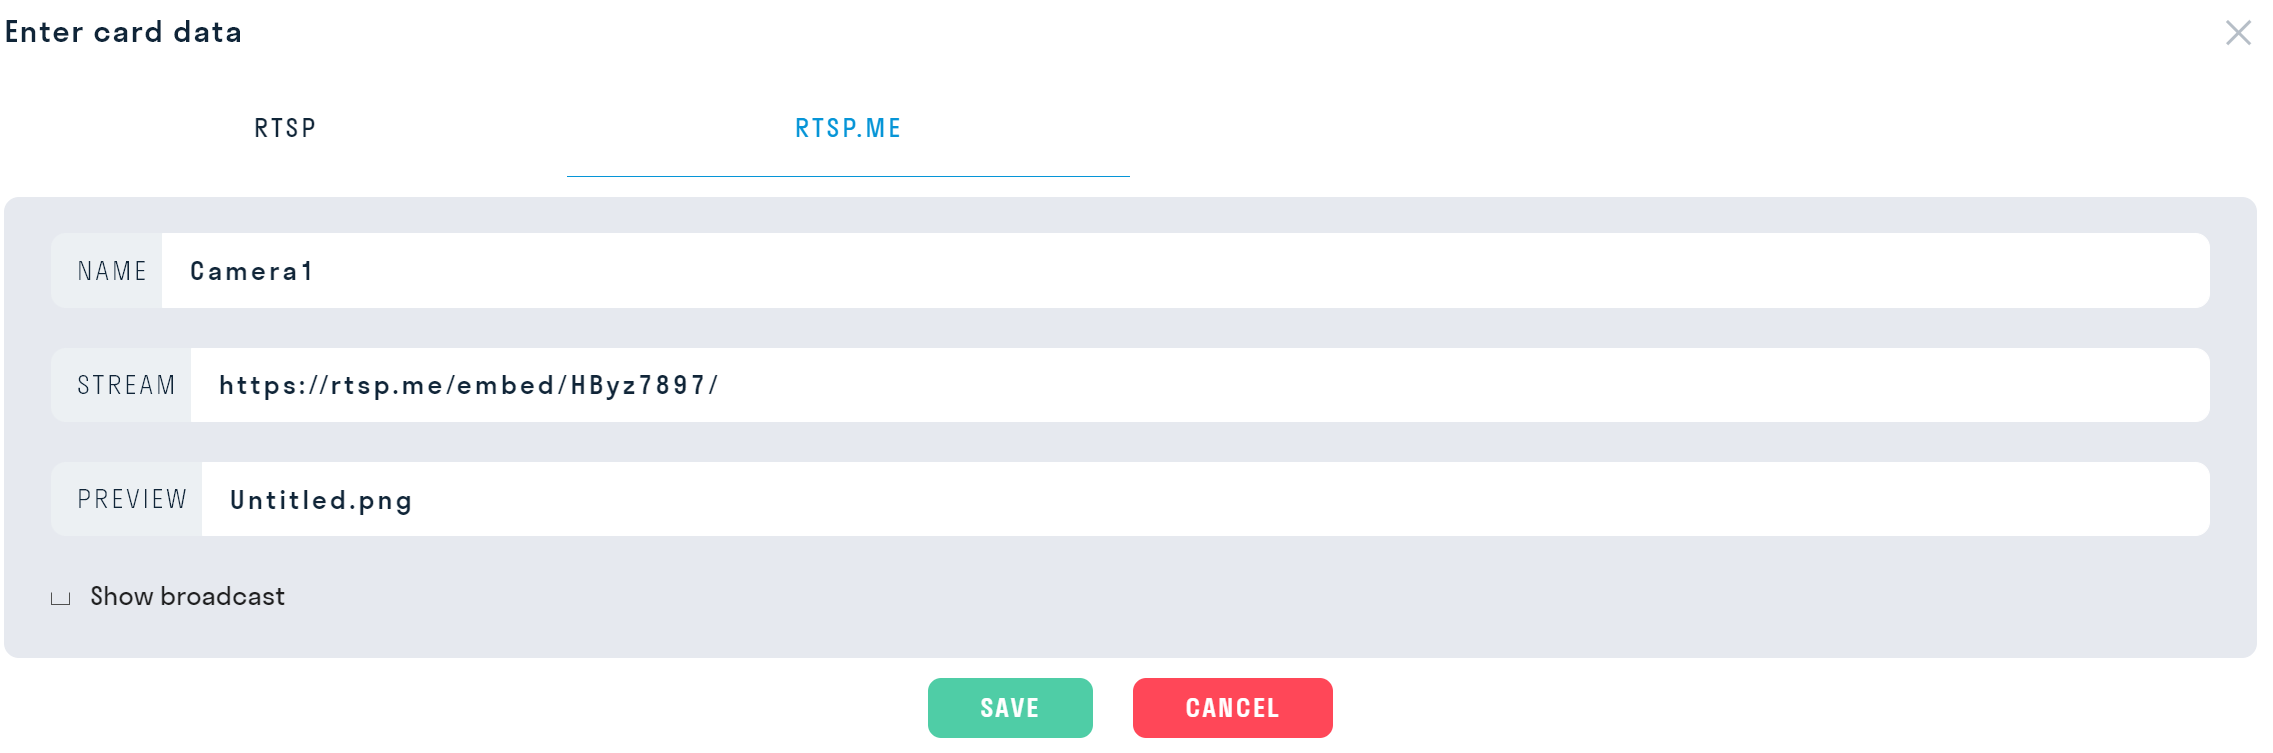
- In the "Name" field, enter the name of the video stream.
- In the "Stream" field, insert the link to the video stream in RTSP.ME format.
- In the "Preview" field, place an image for the card preview. The "Display Stream" switch allows selecting from which tab to display the stream in the card: from RTSP or RTSP.ME.
Stream view
When viewing the card in user mode, you can switch between two video stream qualities:
 Viewing mode in HD quality (high-quality format).
 When deselecting the checkbox, the viewing quality becomes low.
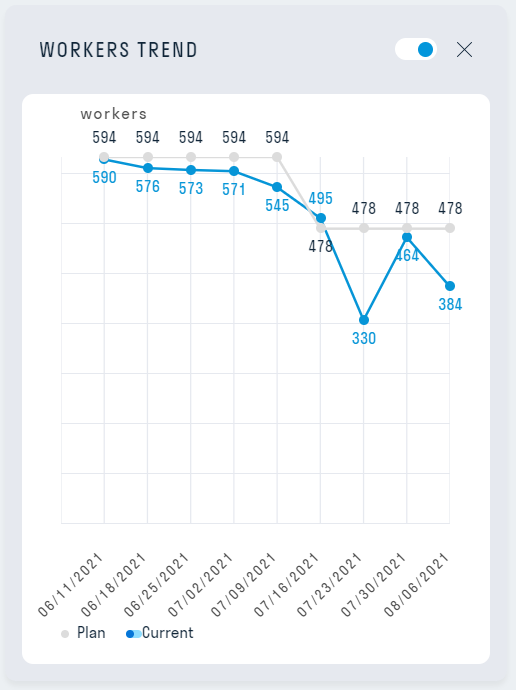
14_Workers trend
15_Dynamics universal
15 Dynamics universal - add multiple columns and enter chronological data
16_Percentage of object readiness
20_Percentage of money spent

21_General cumulative by money

22_Mastering money by month
22_Mastering money by month - data visualization on how much was paid compared with a payment plan.
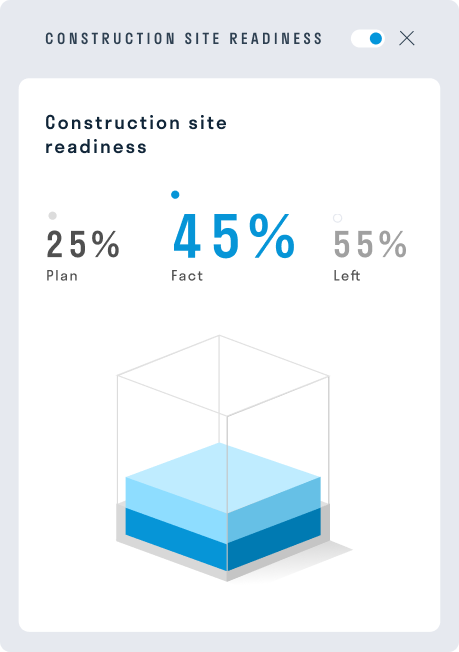
30_Percentage of implementation period

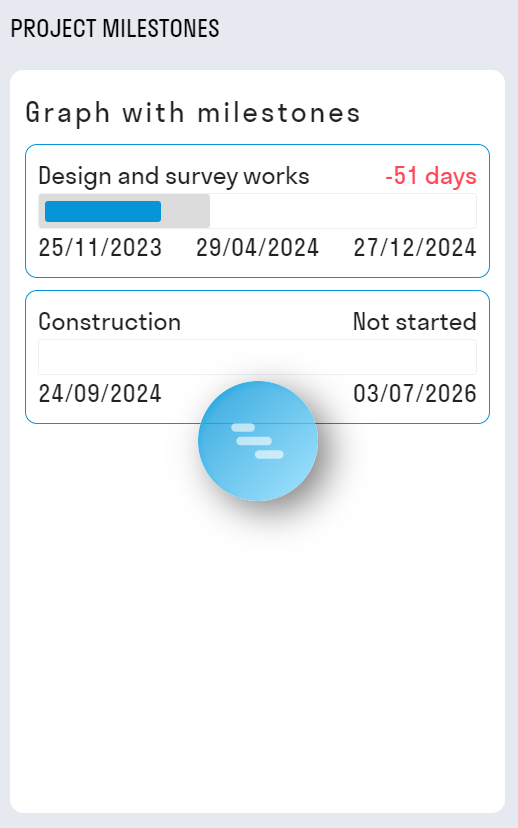
31_Project milestones
31_Project milestones
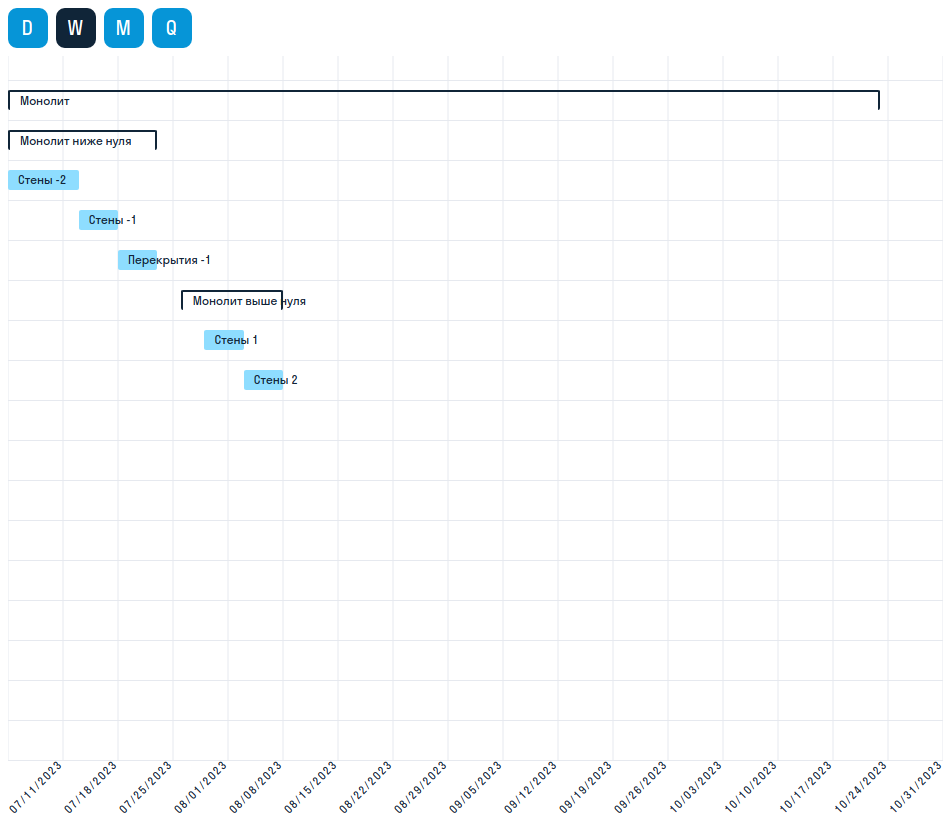
32_Graph excel
32_Graph excel
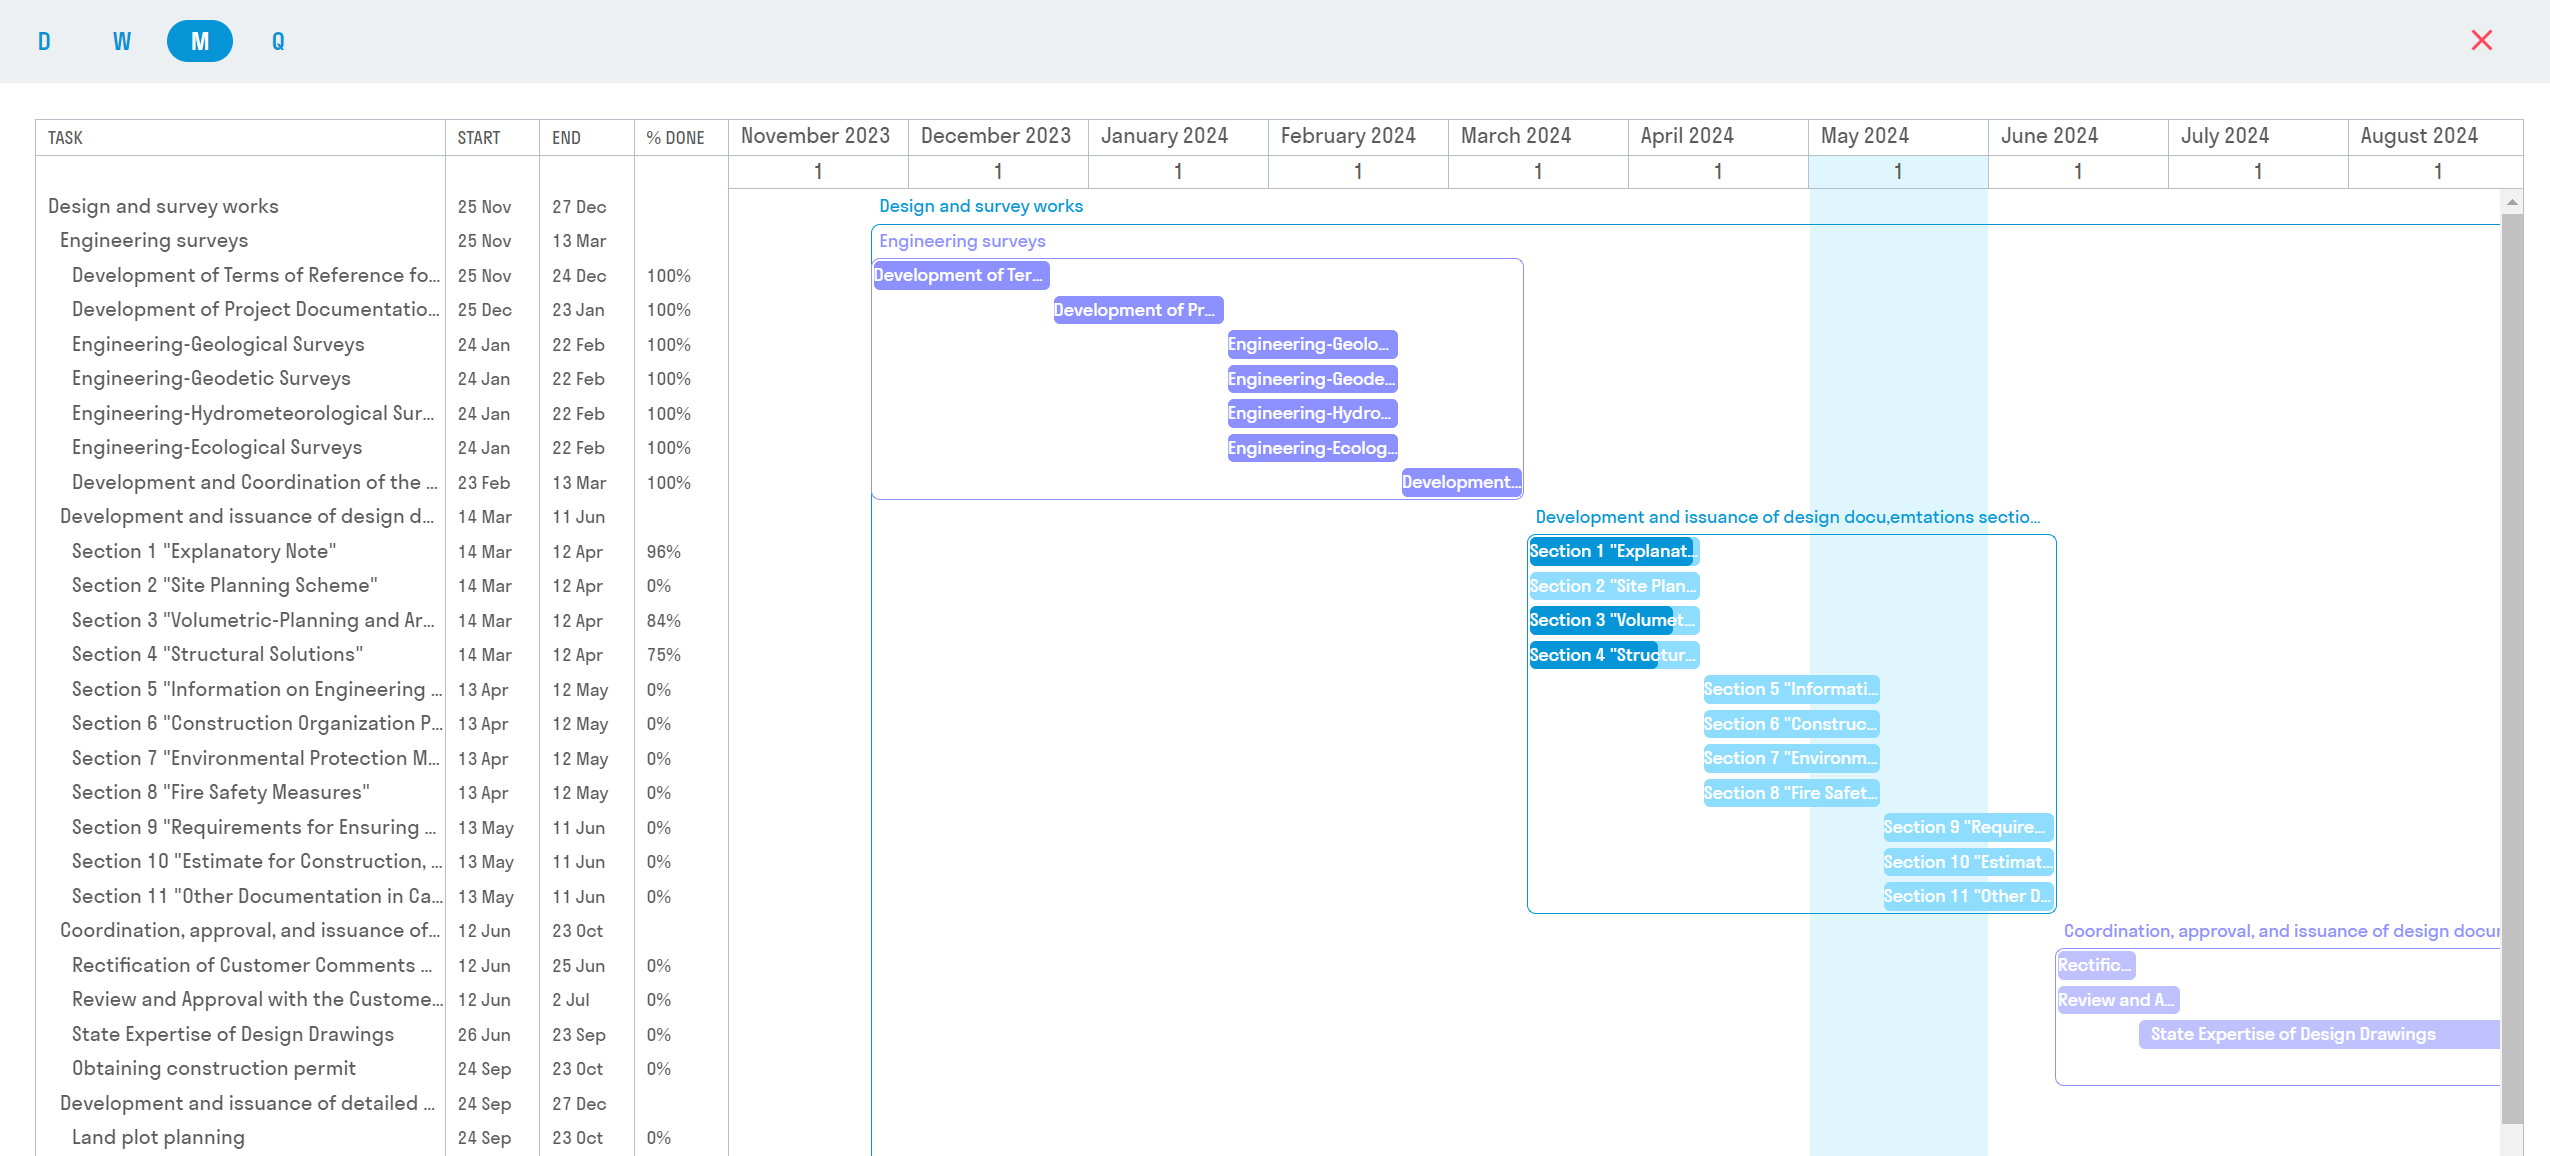
33_Graph MPP
33_Graph MPP
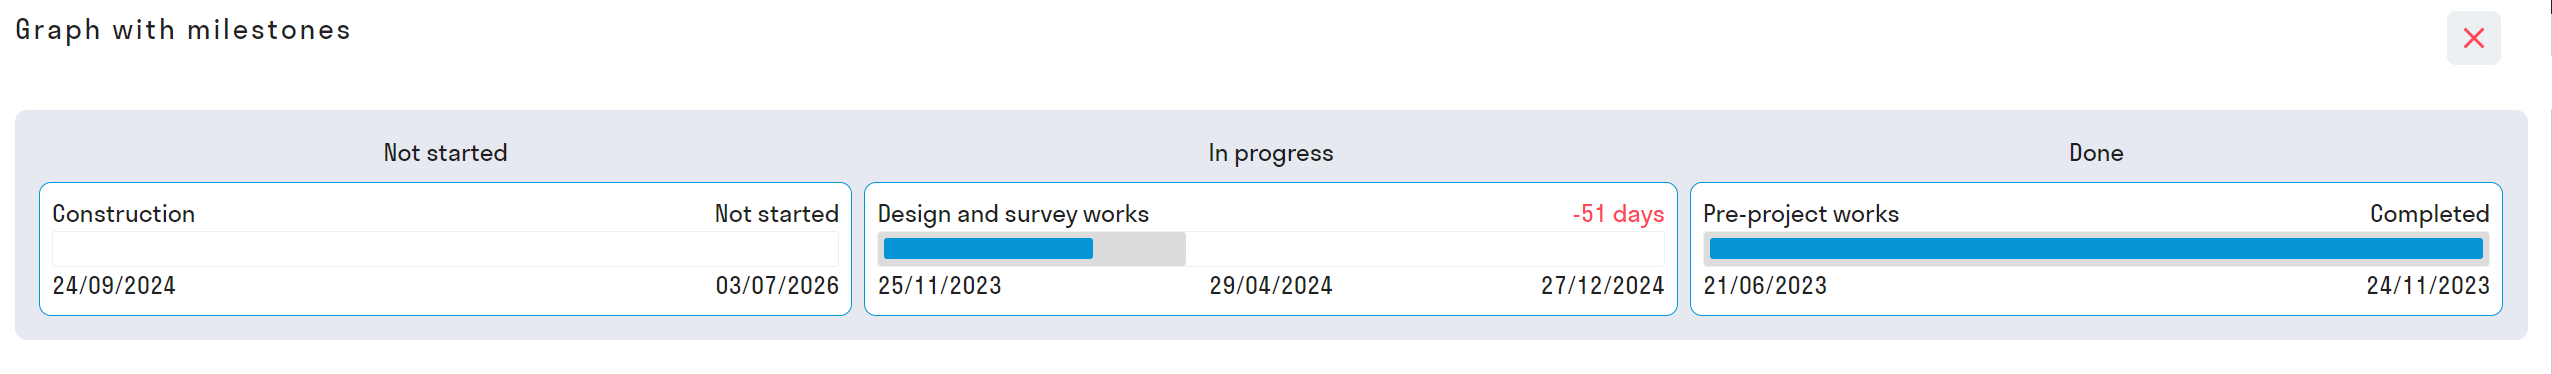
34_Graph MPP with milestones
34_Graph MPP with milestones
35_Chart


-
1.by day
-
2.by week
-
3.by month
-
4.by quarter
36_Chart
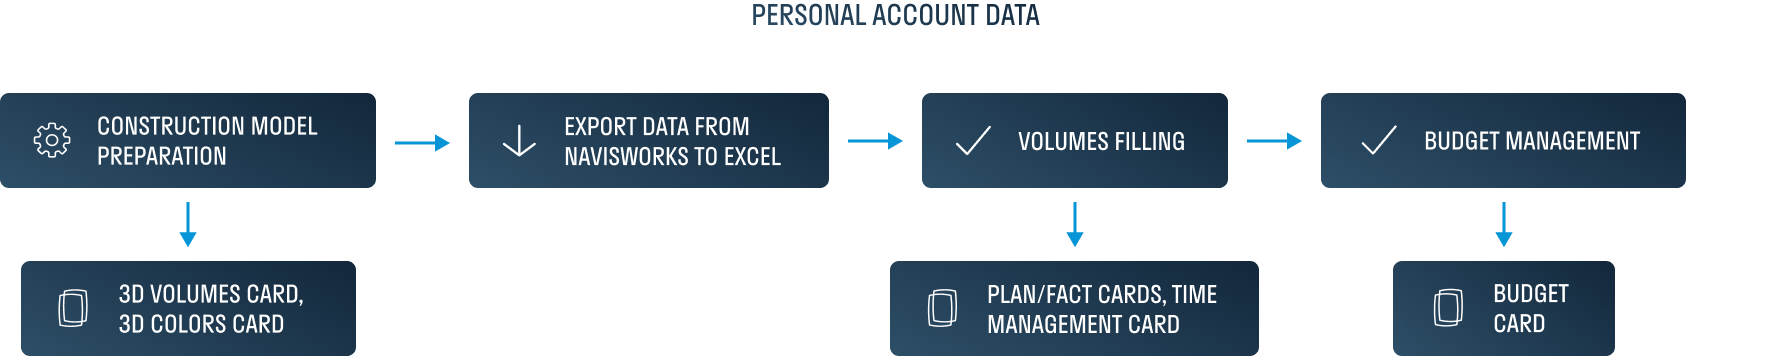
41_Plan-Actual volumes

43_Execution rates by volume

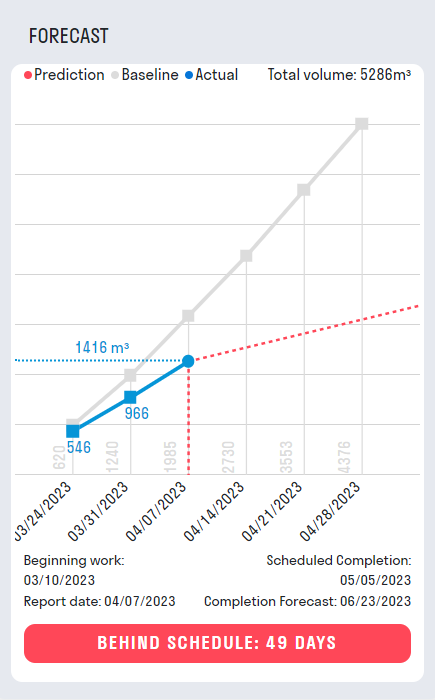
45_Forecast
44_Forecast - prediction of work completion;
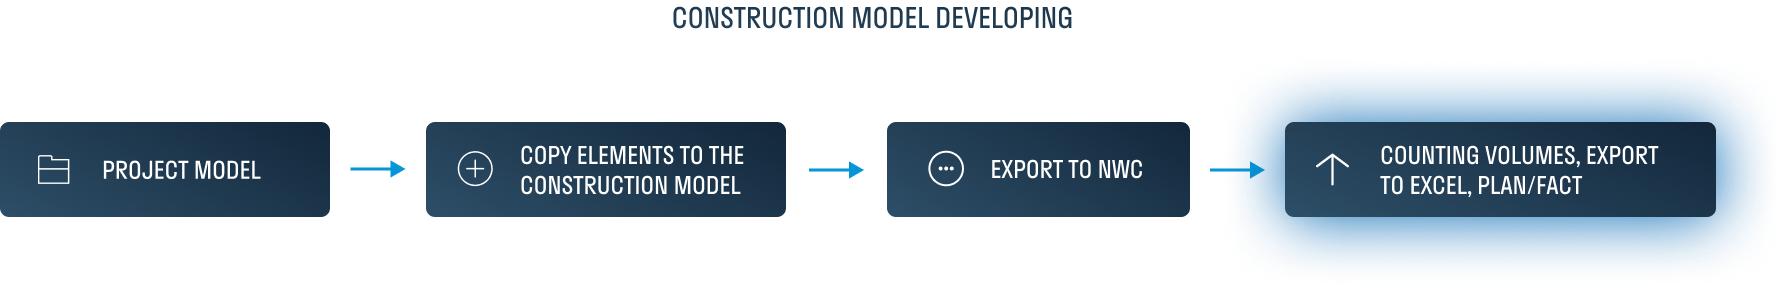
52_Summary BIM model
54_BIM model by color
55_BIM planned volumes

56_BIM actual volumes
-
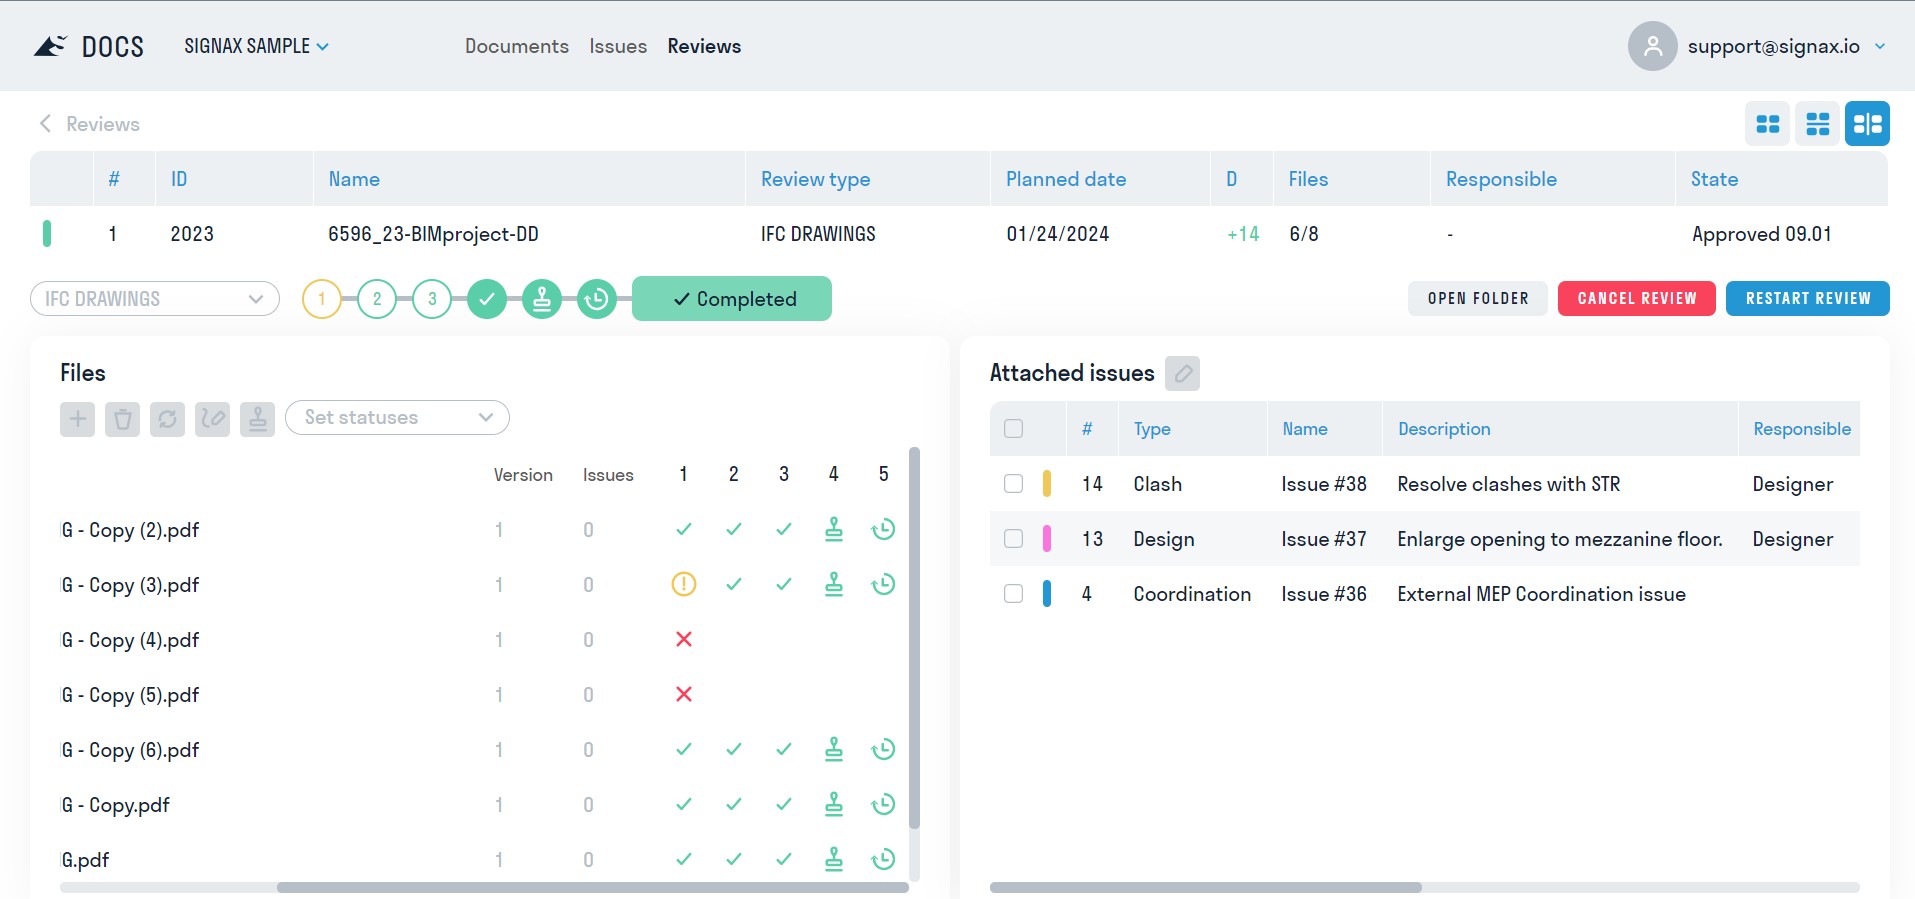
56_BIM actual volumes - Displays Navisworks .nwd model files by clicking on the slide image. You must paste the Autodesk Docs link to the .nwd file;


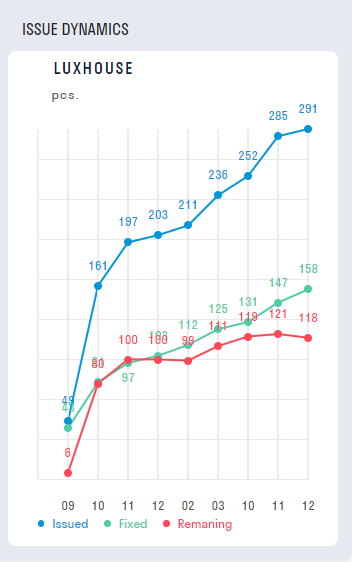
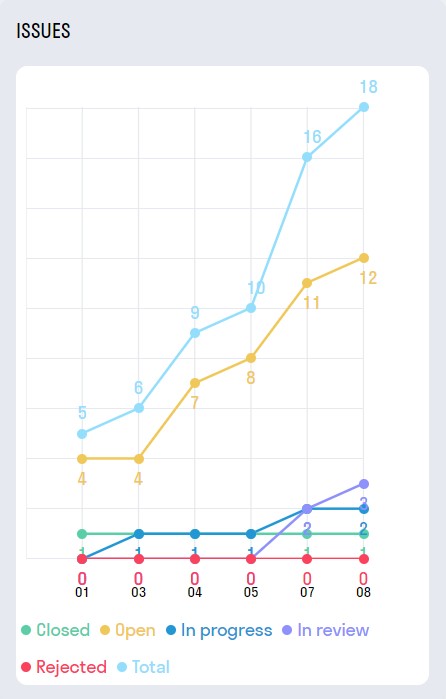
62_Issues DOCS
- 62_Issues DOCS - The card displays all SIGNAX DOCS Issues statuses in the form of a graph.
Card view in Report mode:
Card settings
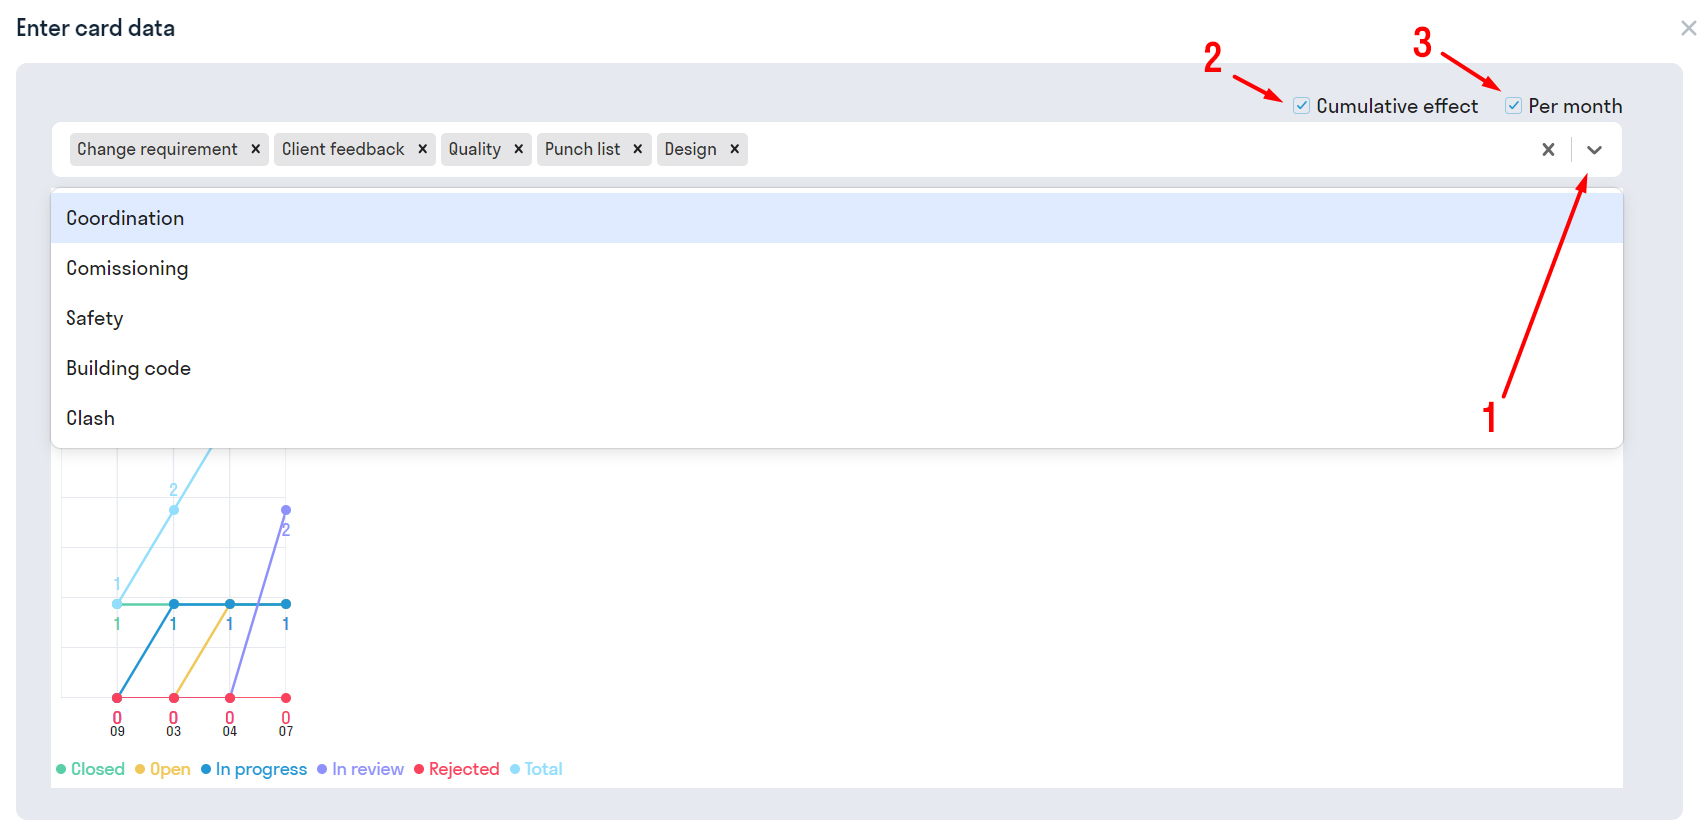
1 - From the dropdown list, select the types of issues to be displayed on the chart.
2 - Display issues with a cumulative effect or the number of issues issued on a specific date.
3 - Display statistics by month.
63_General reviews in DOCS
- 63_General reviews in DOCS - this card allows you to display statistics on reviews from SIGNAX DOCS in the form of a pie chart.
Card view in Report mode:
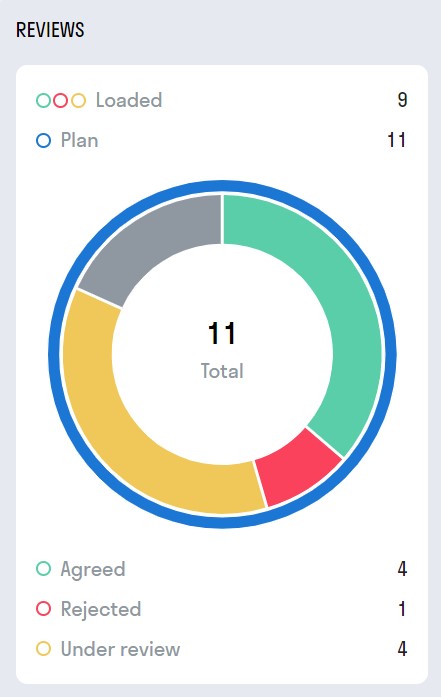
Card settings:
Select the types of reviews to be included in the statistics from the dropdown list.
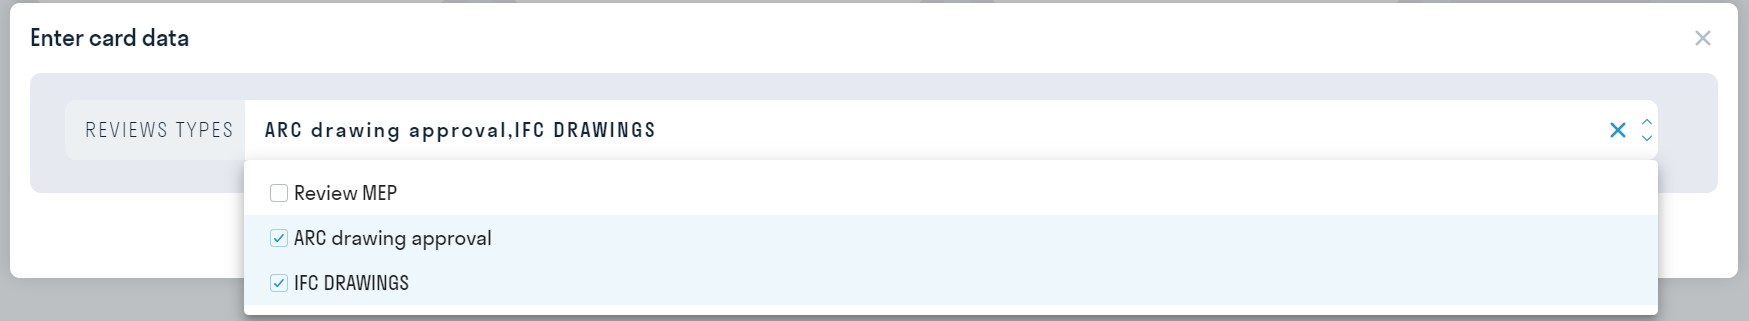
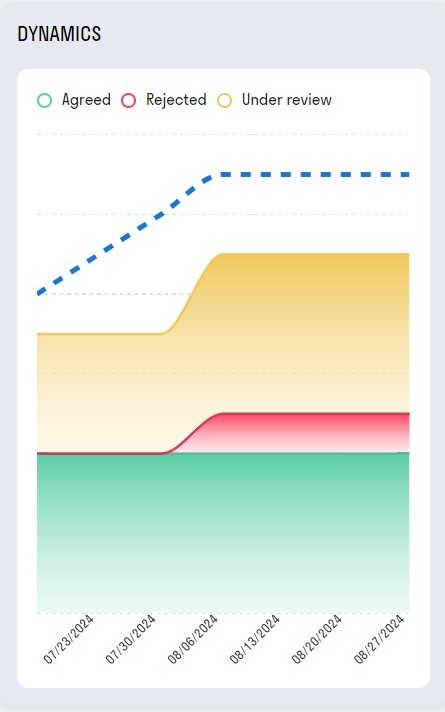
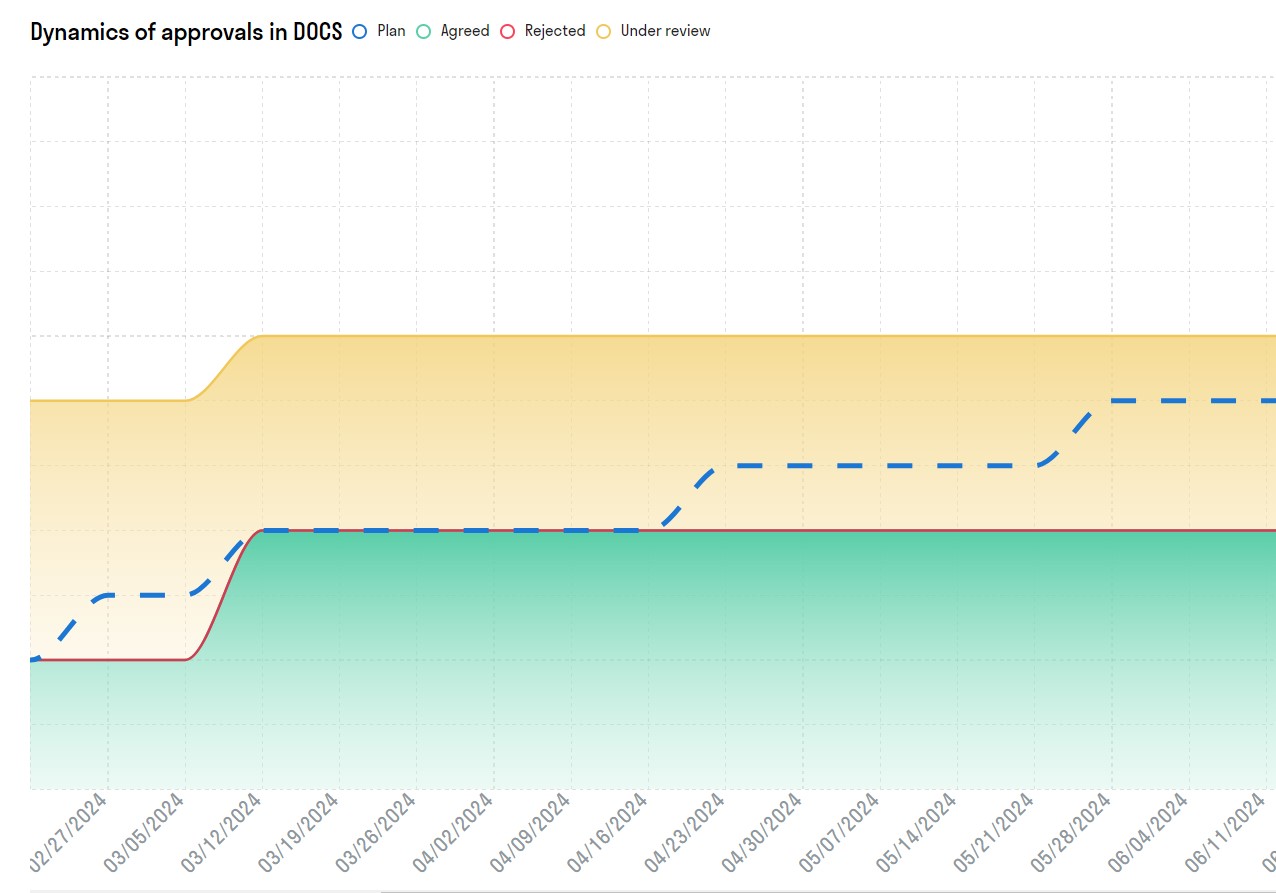
64_Dynamics of reviews DOCS
- 64_Dynamics of reviews DOCS - his card displays a chart of reviews, intended for analyzing the dynamics of documentation release.
Card view in Report mode:
When opening the card:
Card settings are similar to 63_General Reviews in DOCS.
65_Register of Reviews DOCS
- 65_Register of Reviews DOCS - this card displays the registry of Reviews from SIGNAX DOCS.
Card view in Report mode:
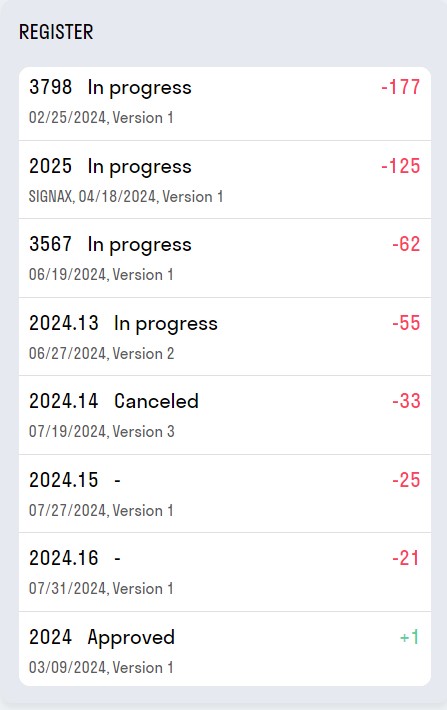
When opening the card:
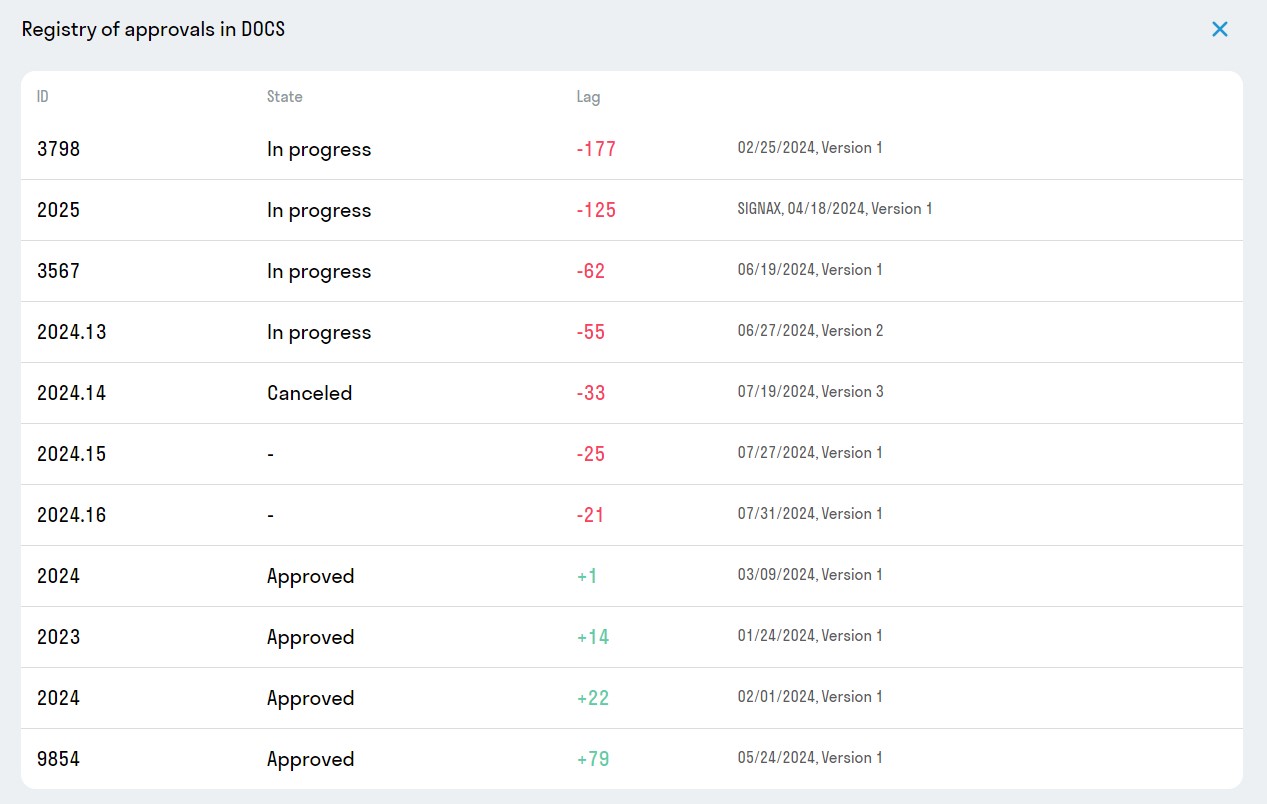
Clicking on a row allows you to navigate to the corresponding Review in SIGNAX DOCS:
Card settings are similar to 63_General Reviews in DOCS.
66_Folders

71_Activity chart ACC

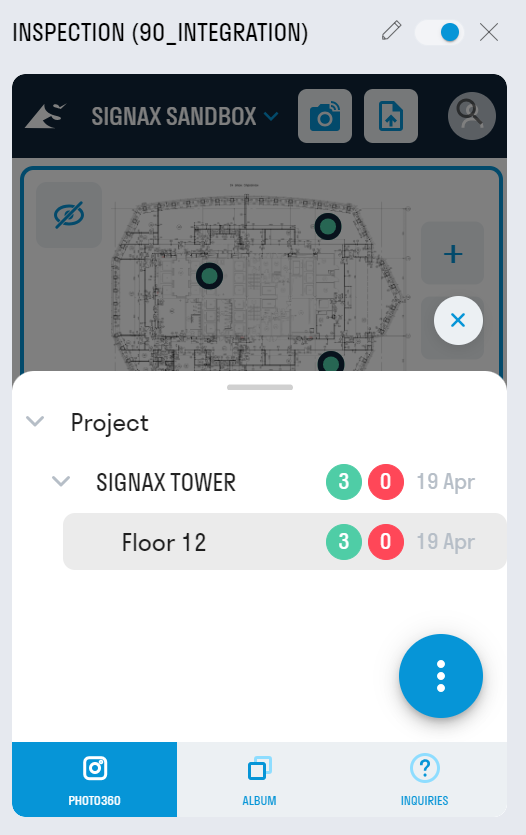
90_Integration
92_YouTube Link